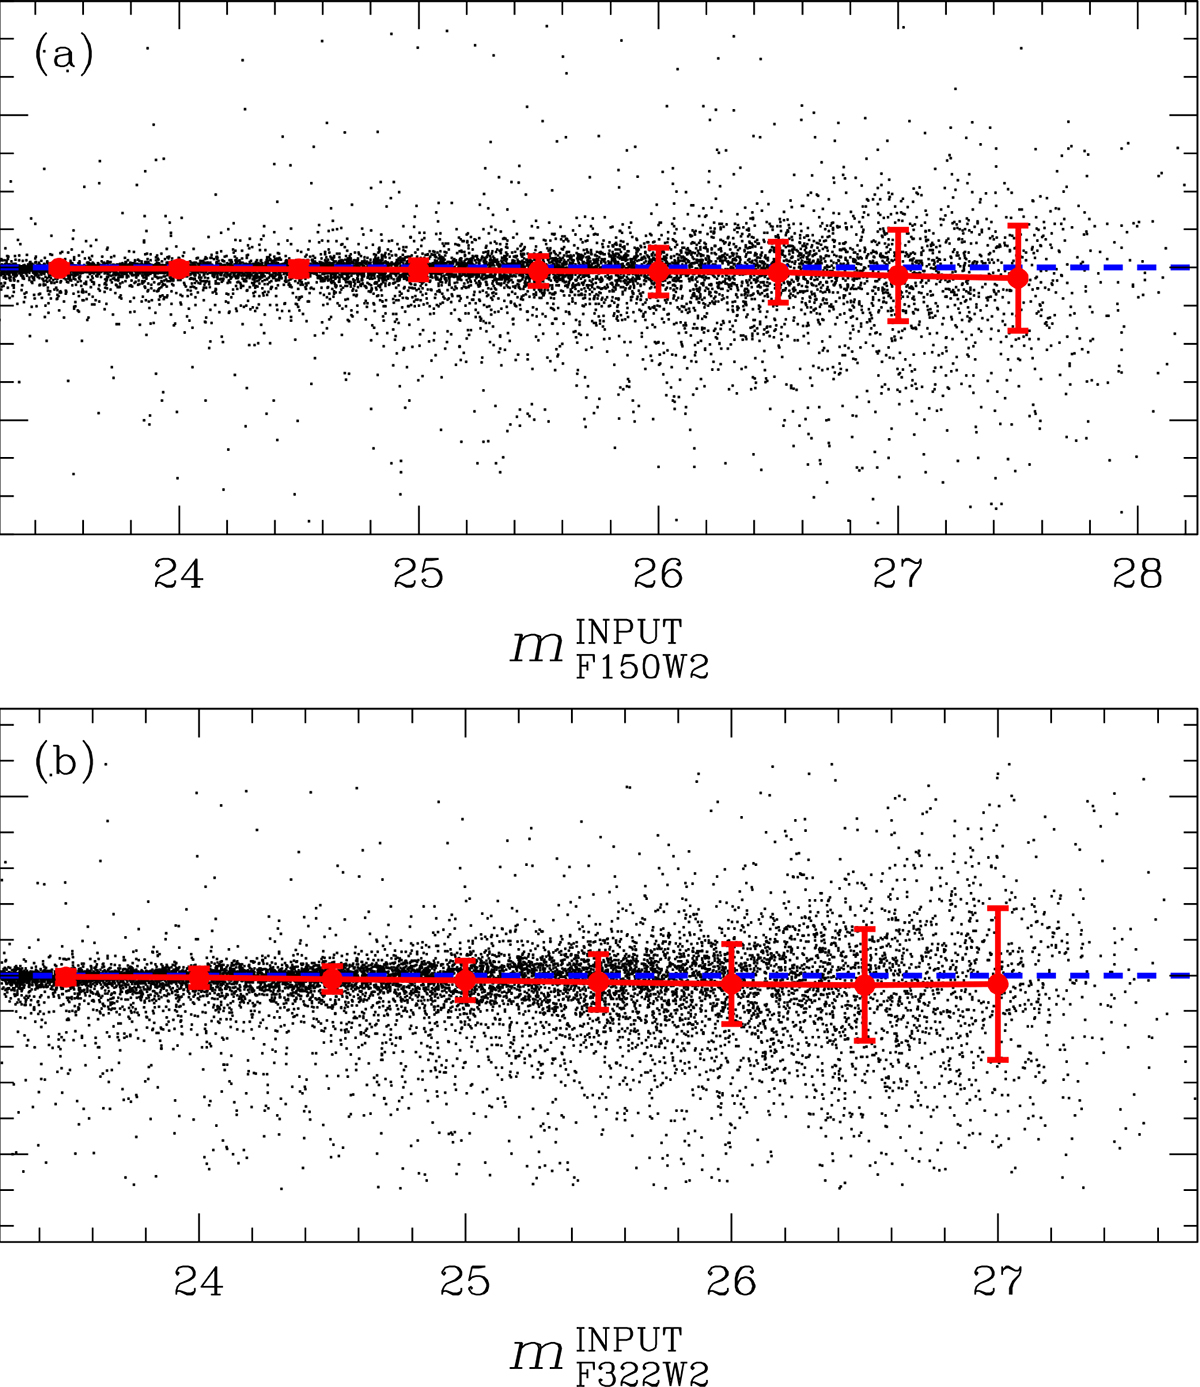
Fig. 4.
Download original image
Photometric uncertainties estimated from ASs: results for the F150W2 filter (a) and the F322W2 filter (b). In each panel, the black points represent the difference between the recovered and input magnitudes of the ASs, plotted as a function of input magnitude. The red points mark the median values in 0.5-magnitude bins, and the error bars indicate the corresponding dispersions (σ) obtained from the 2.5σ-clipped distributions. The dashed blue line marks zero.
Current usage metrics show cumulative count of Article Views (full-text article views including HTML views, PDF and ePub downloads, according to the available data) and Abstracts Views on Vision4Press platform.
Data correspond to usage on the plateform after 2015. The current usage metrics is available 48-96 hours after online publication and is updated daily on week days.
Initial download of the metrics may take a while.