Fig. 7.
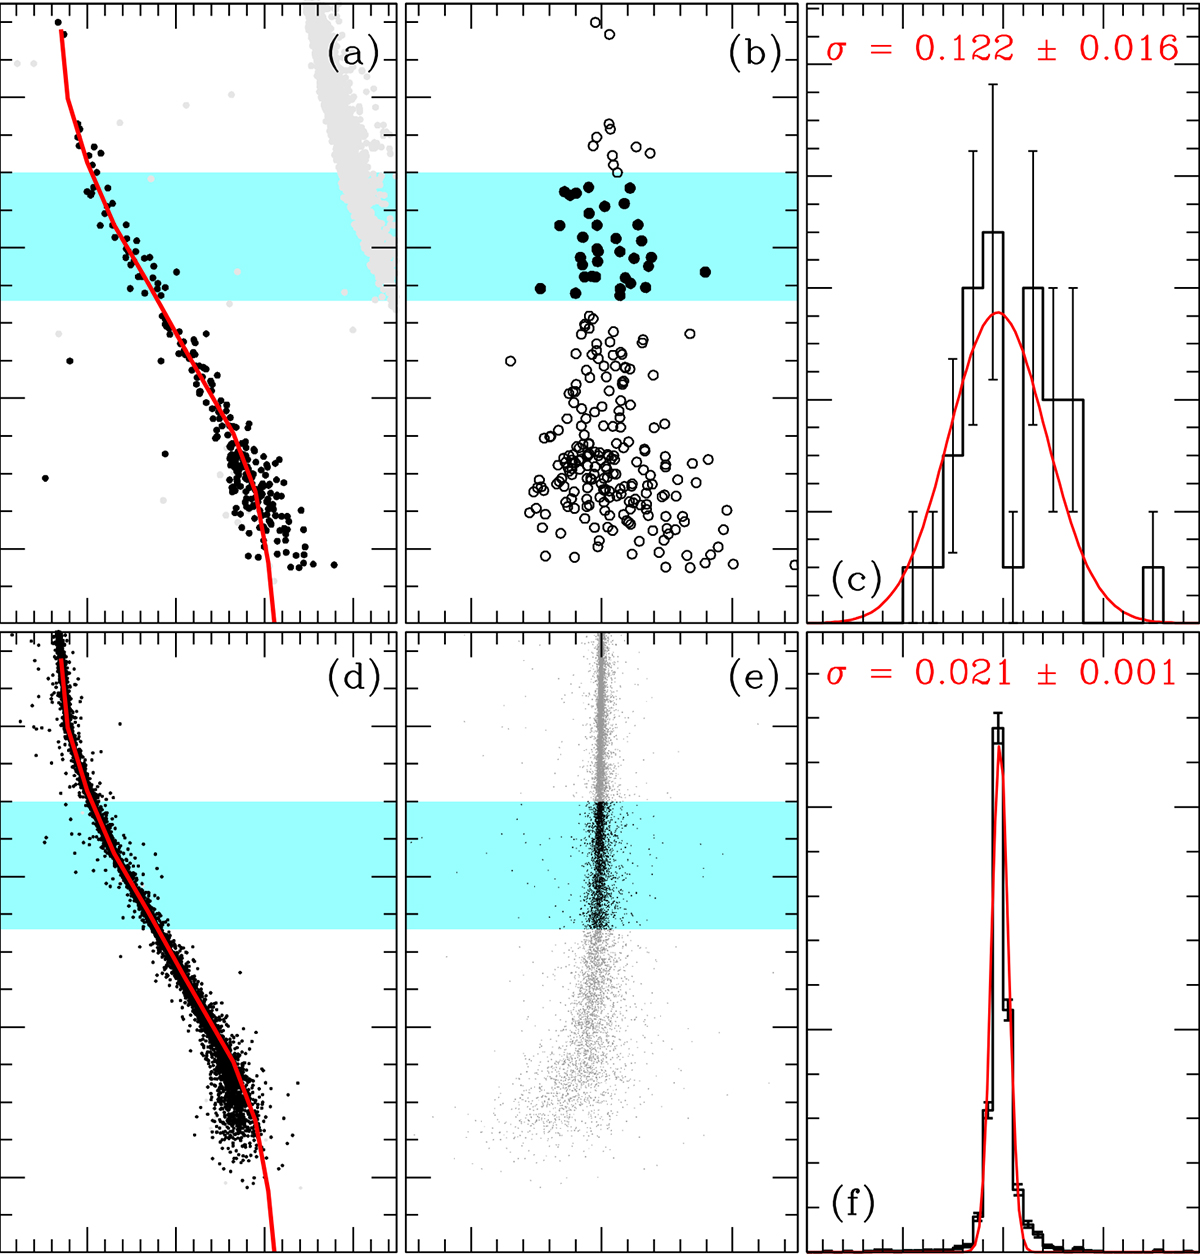
Download original image
Comparison of the observed and AS distributions for real stars (top panels) and ASs (bottom panels). Black points indicate the sources located between the two green fiducial lines in Fig. 1f, whereas grey points mark the remaining stars. (a)-(d): mF606W versus mF606W − mF150W2 CMDs. The red line represents the fiducial sequence used to inject ASs. (b)-(e): Verticalised CMDs based on the fiducial sequence. ΔF606W − F150W2 represents the verticalised colour. (c)-(f): Histograms of the colour distribution for sources within the cyan-shaded regions of the verticalised CMDs. The red curves show Gaussian fits, with the dispersion (σ) computed from the 68.27th percentile of the distributions. The corresponding σ values are indicated in each panel.
Current usage metrics show cumulative count of Article Views (full-text article views including HTML views, PDF and ePub downloads, according to the available data) and Abstracts Views on Vision4Press platform.
Data correspond to usage on the plateform after 2015. The current usage metrics is available 48-96 hours after online publication and is updated daily on week days.
Initial download of the metrics may take a while.