Fig. 9.
Download original image
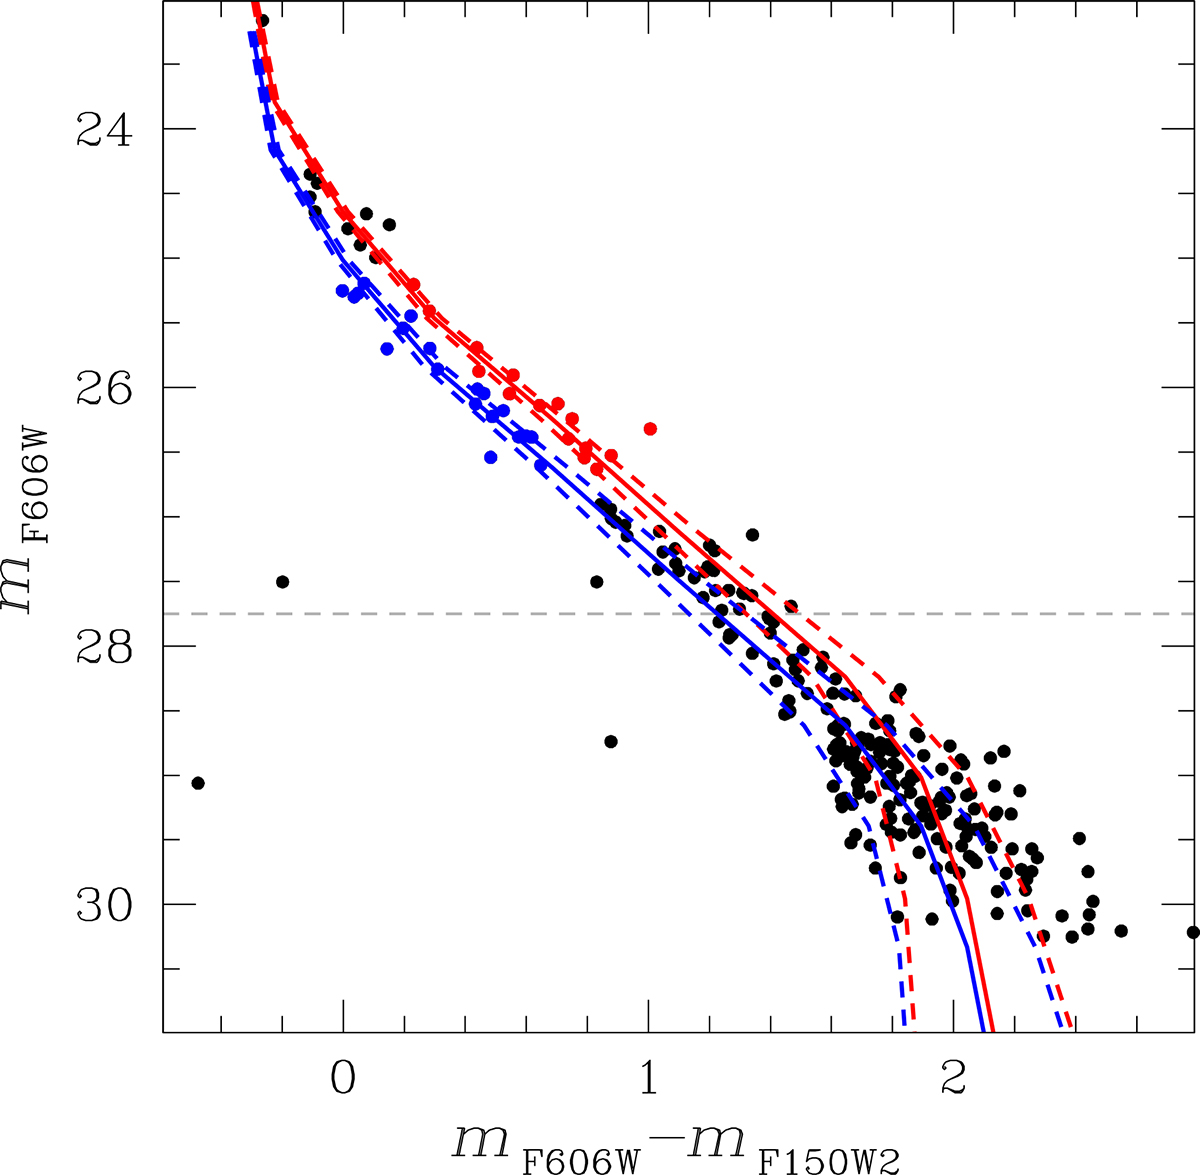
mF606W versus mF606W − mF150W2 CMD for the selected sample of WDs, with stars colour-coded as in panel (a) of Fig. 8. The solid red and blue lines represent fiducials for the two sequences. Dashed lines denote the ±1σ colour uncertainty (from ASs tests) around each fiducial. The horizontal dashed grey line marks the magnitude below which the two sequences can no longer be separated, as the colour difference between the fiducials becomes comparable to the photometric errors.
Current usage metrics show cumulative count of Article Views (full-text article views including HTML views, PDF and ePub downloads, according to the available data) and Abstracts Views on Vision4Press platform.
Data correspond to usage on the plateform after 2015. The current usage metrics is available 48-96 hours after online publication and is updated daily on week days.
Initial download of the metrics may take a while.