Fig. 4
Download original image
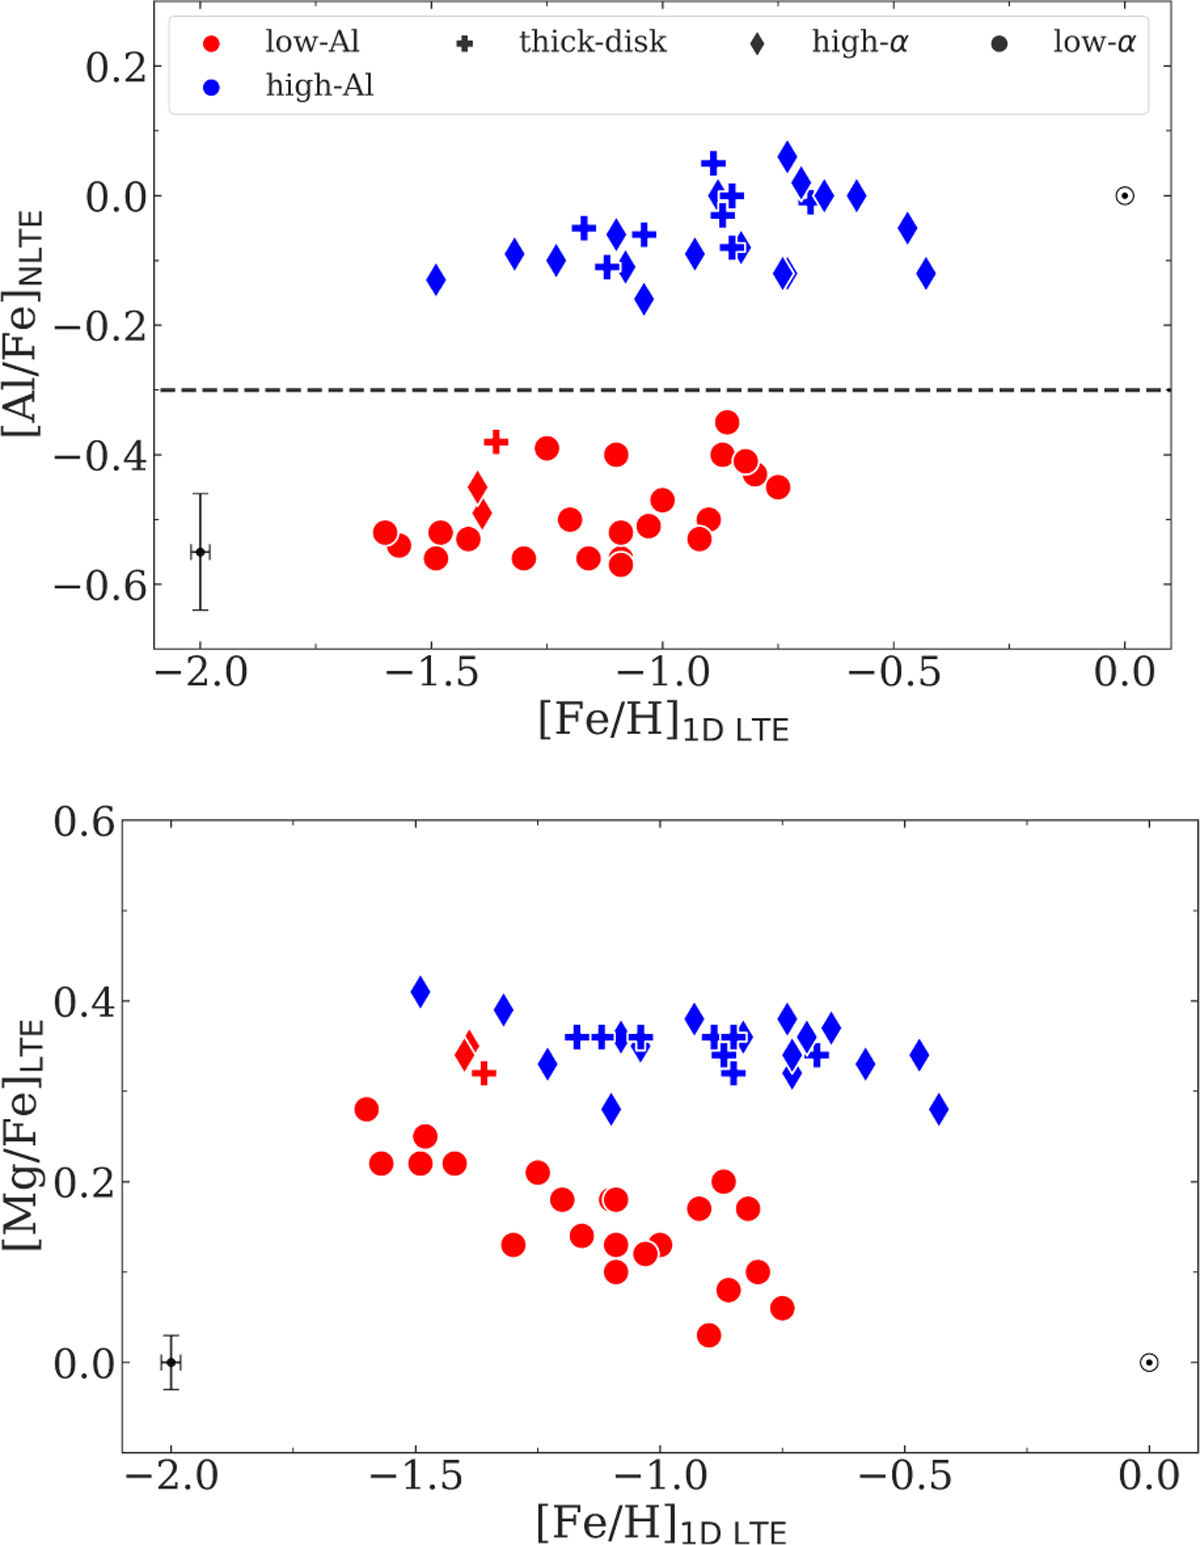
Top panel: Relation between [Al/Fe] and [Fe/H] for the stellar sample. The elemental abundances derived under NLTE assumptions for the Al I 3961 Å line. The data are colour-coded by high-Al and low-Al, with symbols following the classification of (Nissen & Schuster 2010). Thick-disc stars are represented by crosses, high-α stars are shown as diamonds, and low-α stars as circles. Bottom panel: Distribution of the stellar sample in the [Mg/Fe]NLTE versus [Fe/H]LTE, according to the low-Al and high-Al classification used in this paper, adopting the same symbols as the top panel.
Current usage metrics show cumulative count of Article Views (full-text article views including HTML views, PDF and ePub downloads, according to the available data) and Abstracts Views on Vision4Press platform.
Data correspond to usage on the plateform after 2015. The current usage metrics is available 48-96 hours after online publication and is updated daily on week days.
Initial download of the metrics may take a while.