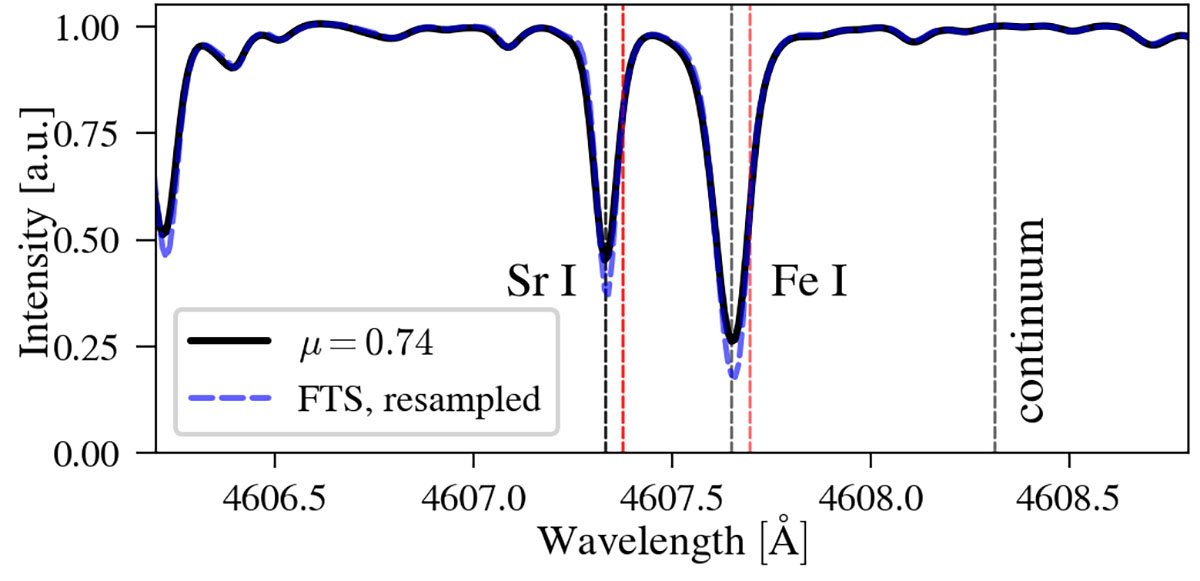
Fig. 1.
Download original image
Intensity spectra from ViSP at μ = 0.74 compared to the FTS atlas (Neckel 1999), resampled to match the ViSP spectral sampling. Dashed vertical black lines mark the line centers of Sr I and Fe I. Dashed red lines indicate the red-wing wavelength positions used for plotting Stokes V/I. All spectra have been normalized to the continuum for display purposes.
Current usage metrics show cumulative count of Article Views (full-text article views including HTML views, PDF and ePub downloads, according to the available data) and Abstracts Views on Vision4Press platform.
Data correspond to usage on the plateform after 2015. The current usage metrics is available 48-96 hours after online publication and is updated daily on week days.
Initial download of the metrics may take a while.