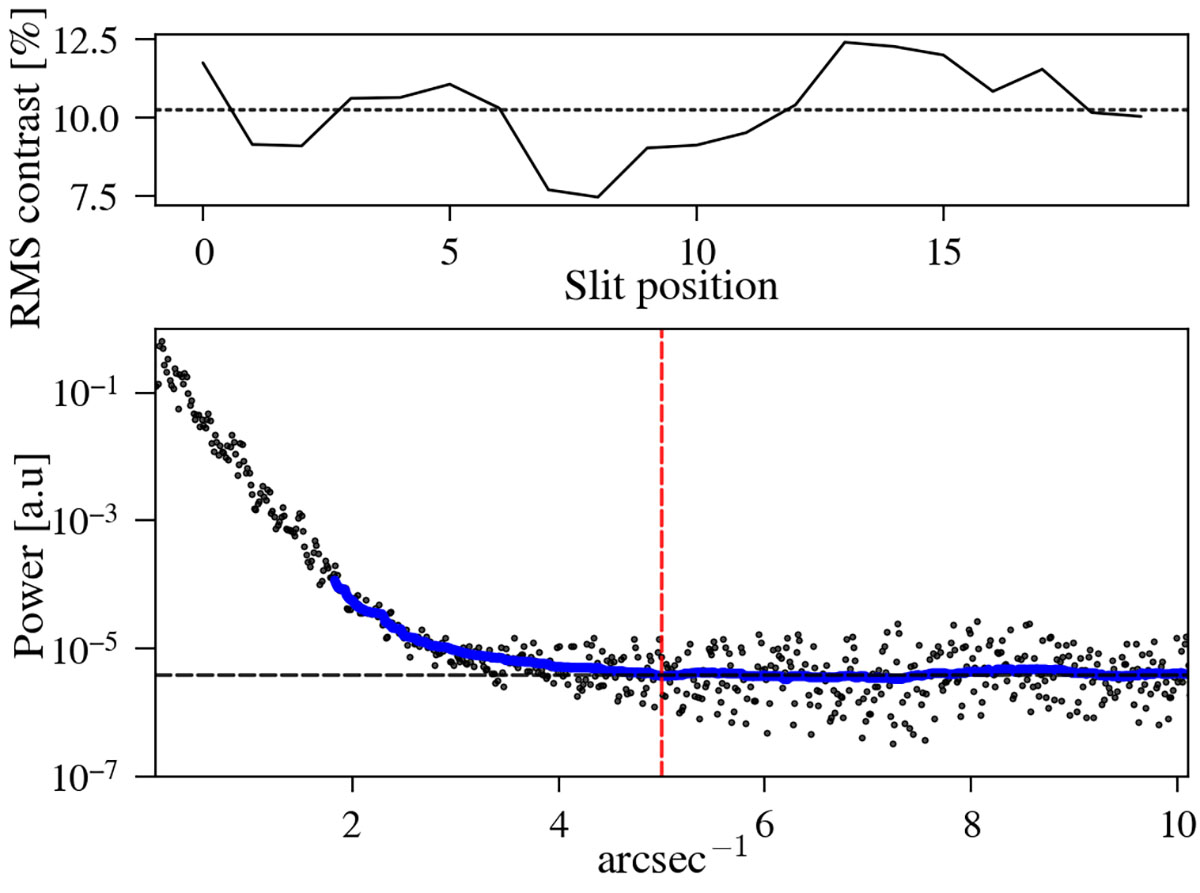
Fig. 2.
Download original image
RMS intensity contrast variation with slit position (upper panel) and power spectrum of the intensity at the center of the Sr I line (lower panel). For the latter, the black dots show the power spectrum windowed by a Hann filter before computing the FFT, summed over all scan positions. The solid blue line shows a median filter applied to the Hann-windowed power spectrum. The vertical dashed red line indicates the frequency that equates to an effective spatial resolution of 0![]() 2.
2.
Current usage metrics show cumulative count of Article Views (full-text article views including HTML views, PDF and ePub downloads, according to the available data) and Abstracts Views on Vision4Press platform.
Data correspond to usage on the plateform after 2015. The current usage metrics is available 48-96 hours after online publication and is updated daily on week days.
Initial download of the metrics may take a while.