Fig. 3.
Download original image
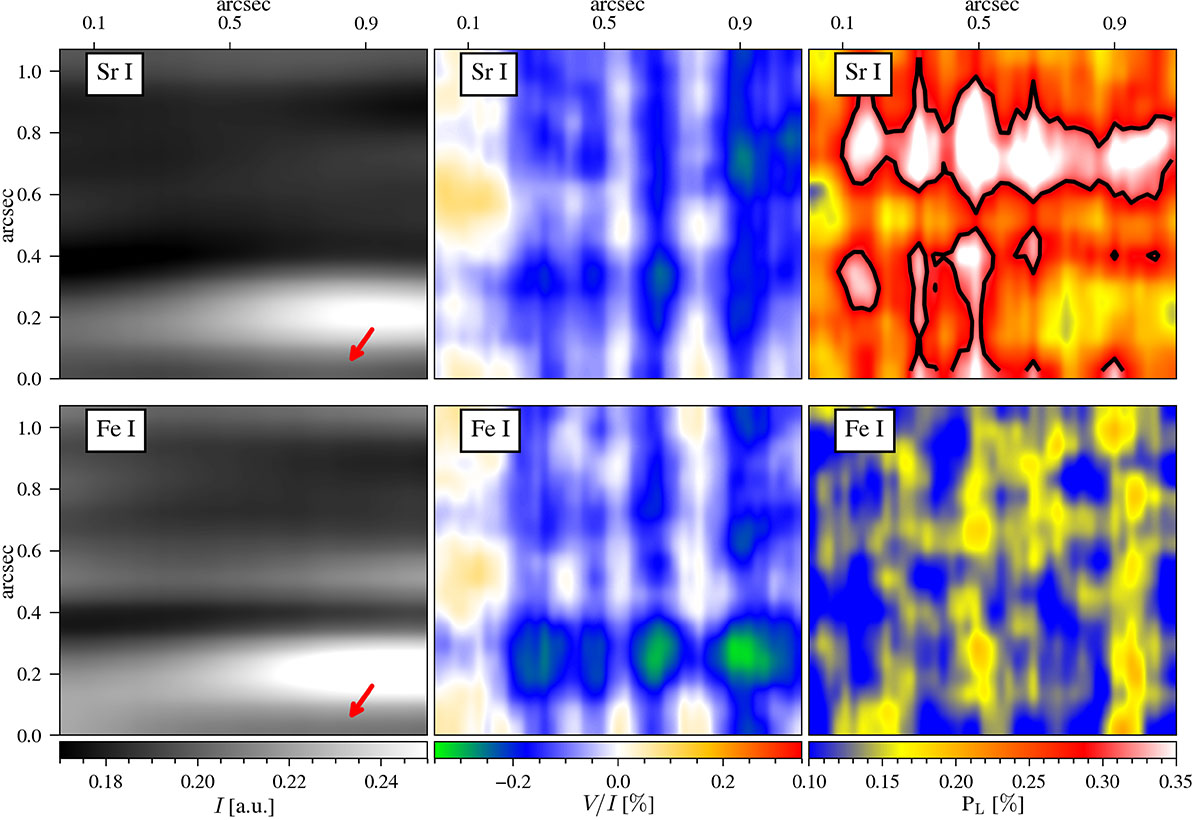
Intensity, circular polarization, and total linear polarization maps (from left to right) in Sr I (top panels) and Fe I (bottom panels) of a 1″ × 1″ quiet Sun region scanned by ViSP at μ = 0.74. Data is spatially binned to 0![]() 1 × 0
1 × 0![]() 1 sampling. Color bars for the polarization maps are applied consistently for both lines. Note that the total linear polarization scale is saturated for Sr I. The approximate solar disk center direction is indicated by the red arrow in the intensity panels. The scanning direction is upward. Contours in black are at the level of 0.3%. The intensity in Sr I has been scaled by a factor of two to get the same intensity scale as for Fe I.
1 sampling. Color bars for the polarization maps are applied consistently for both lines. Note that the total linear polarization scale is saturated for Sr I. The approximate solar disk center direction is indicated by the red arrow in the intensity panels. The scanning direction is upward. Contours in black are at the level of 0.3%. The intensity in Sr I has been scaled by a factor of two to get the same intensity scale as for Fe I.
Current usage metrics show cumulative count of Article Views (full-text article views including HTML views, PDF and ePub downloads, according to the available data) and Abstracts Views on Vision4Press platform.
Data correspond to usage on the plateform after 2015. The current usage metrics is available 48-96 hours after online publication and is updated daily on week days.
Initial download of the metrics may take a while.