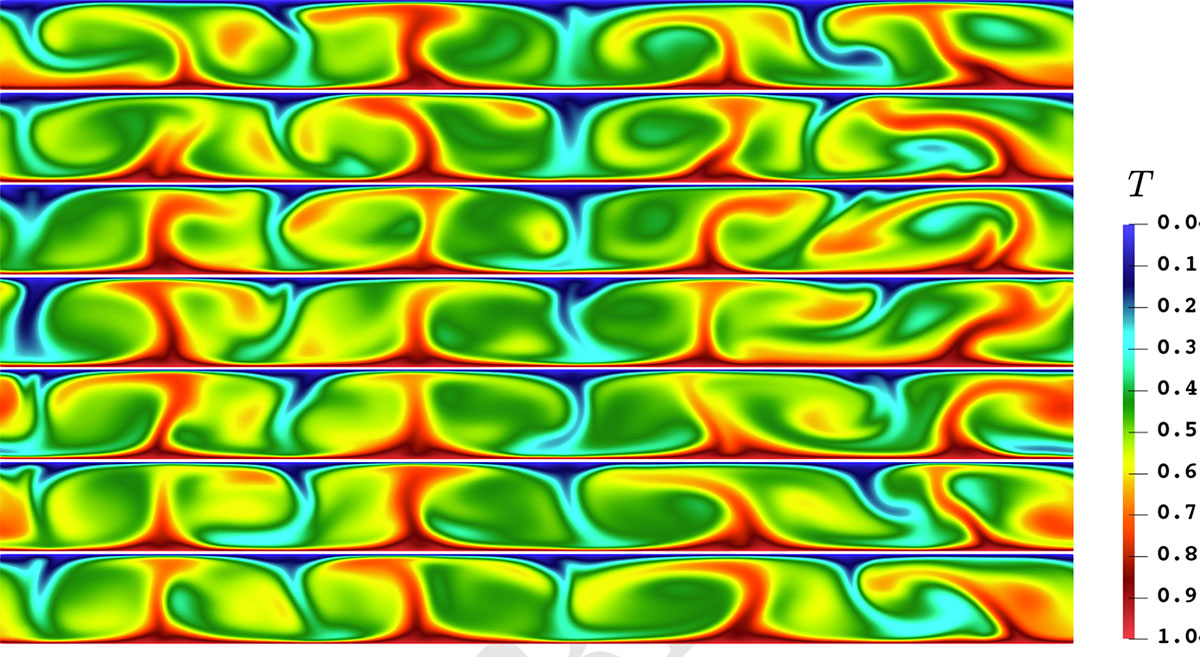
Fig. 1.
Download original image
Evolution of the temperature field for the simulation with Pr = 0.01 (last row in Table 1). The snapshots shown here are separated by 18 simulation time steps (time increases downward). The full sequence covers slightly more than two convective turnover times and shows a full period of the swaying oscillations of the hot and cold plumes. These oscillations are most easily seen in the movies on temperature (T-Pr001.mp4), horizontal velocity (u_x-Pr001.mp4), and vertical velocity (u_z-Pr001.mp4), which we include as supplemental material and which are available here and online. In all three movies, the corresponding quantity is shown in dimensionless units: the temperature is scaled relative to the difference between bottom and top, and the velocities relative to the ratio of the box size and the diffusion timescale.
Current usage metrics show cumulative count of Article Views (full-text article views including HTML views, PDF and ePub downloads, according to the available data) and Abstracts Views on Vision4Press platform.
Data correspond to usage on the plateform after 2015. The current usage metrics is available 48-96 hours after online publication and is updated daily on week days.
Initial download of the metrics may take a while.