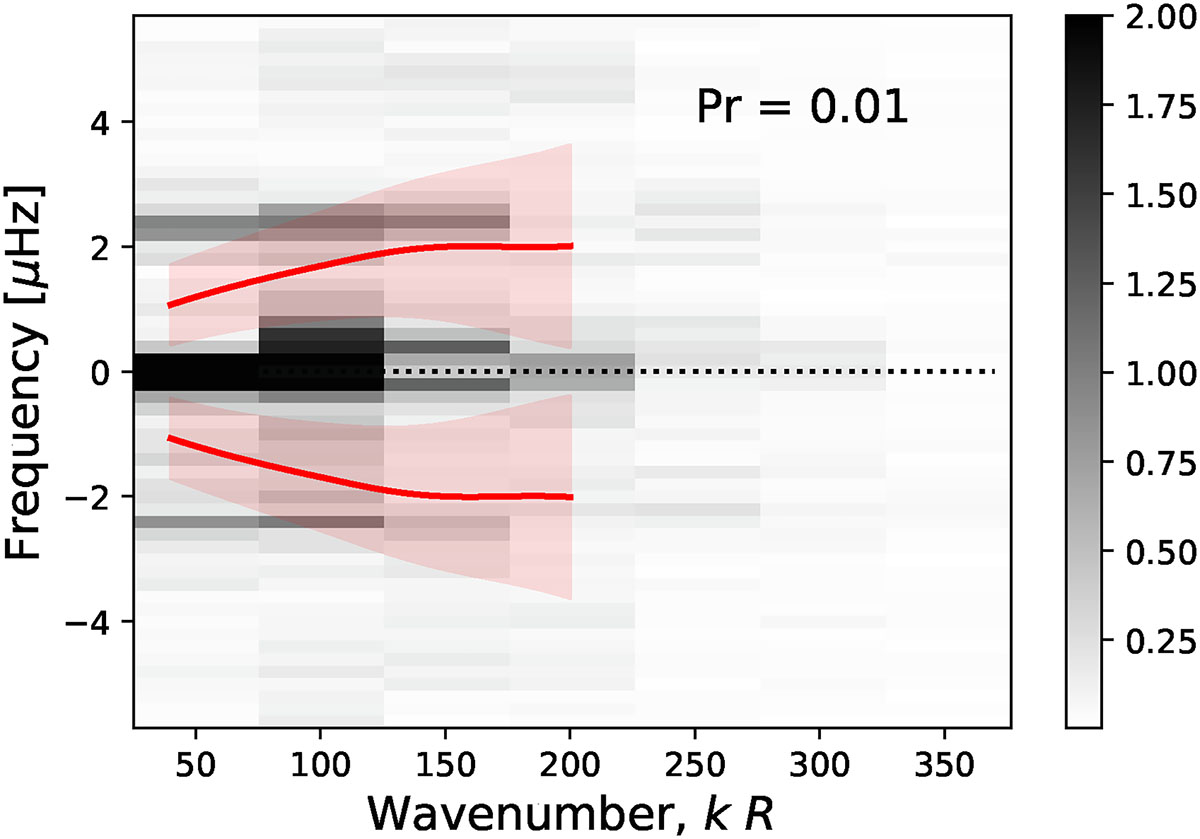
Fig. 3.
Download original image
Two-dimensional power spectrum P(k, ν) of the horizontal velocity at a height z0 = 0.7H for the simulation with Pr = 0.01 (gray shades). To reduce random noise, the data were binned to the spectral resolutions Δk = 50/R and Δν = 0.2 μHz. The grayscale is saturated to highlight the peaks near ±ν0. For reference, the red curves correspond to the dispersion relation observed on the Sun (Langfellner et al. 2018), together with the full widths at half maximum of the power peaks (red shades).
Current usage metrics show cumulative count of Article Views (full-text article views including HTML views, PDF and ePub downloads, according to the available data) and Abstracts Views on Vision4Press platform.
Data correspond to usage on the plateform after 2015. The current usage metrics is available 48-96 hours after online publication and is updated daily on week days.
Initial download of the metrics may take a while.