Fig. 1
Download original image
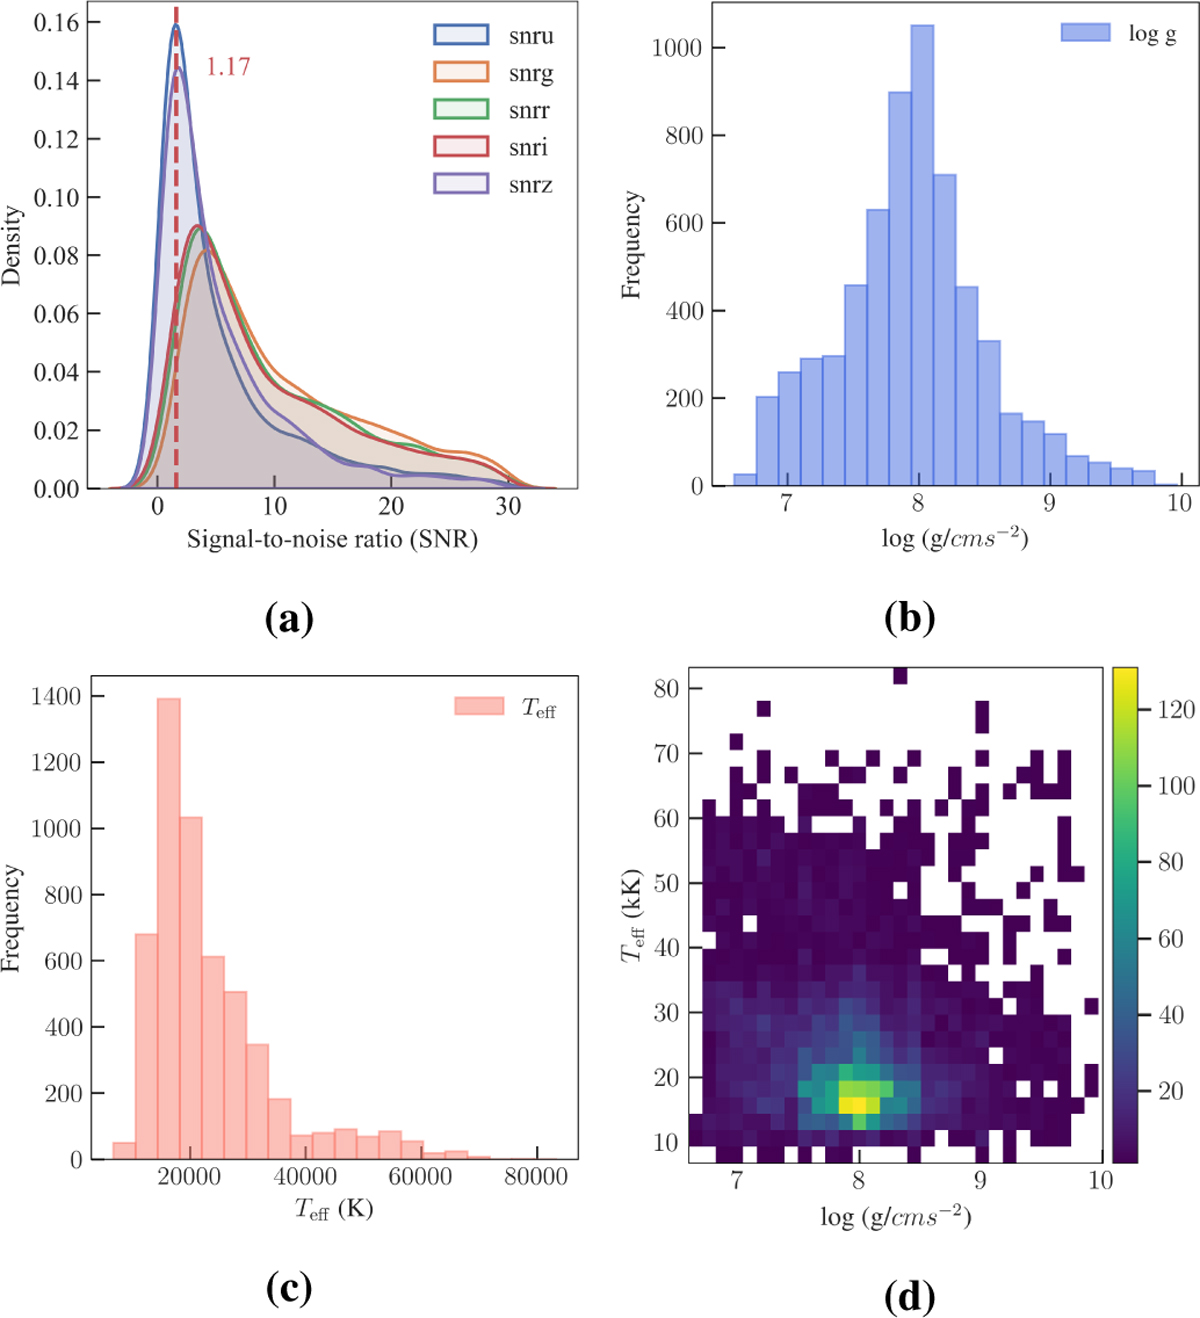
Data description. (a) Signal-to-noise ratio distribution across the u, g, r, i, z bands from LAMOST. White dwarfs’ characteristics are primarily concentrated in the u band, with a median S/N of 3.14 and a mode of 1.17, indicating extremely poor data quality. (b) Distribution of log g labels, primarily concentrated around 8 dex. (c) Distribution of Teff labels, primarily concentrated around 20 000 K. (d) Two-dimensional histogram of the distribution in the parameter space.
Current usage metrics show cumulative count of Article Views (full-text article views including HTML views, PDF and ePub downloads, according to the available data) and Abstracts Views on Vision4Press platform.
Data correspond to usage on the plateform after 2015. The current usage metrics is available 48-96 hours after online publication and is updated daily on week days.
Initial download of the metrics may take a while.