Fig. 10
Download original image
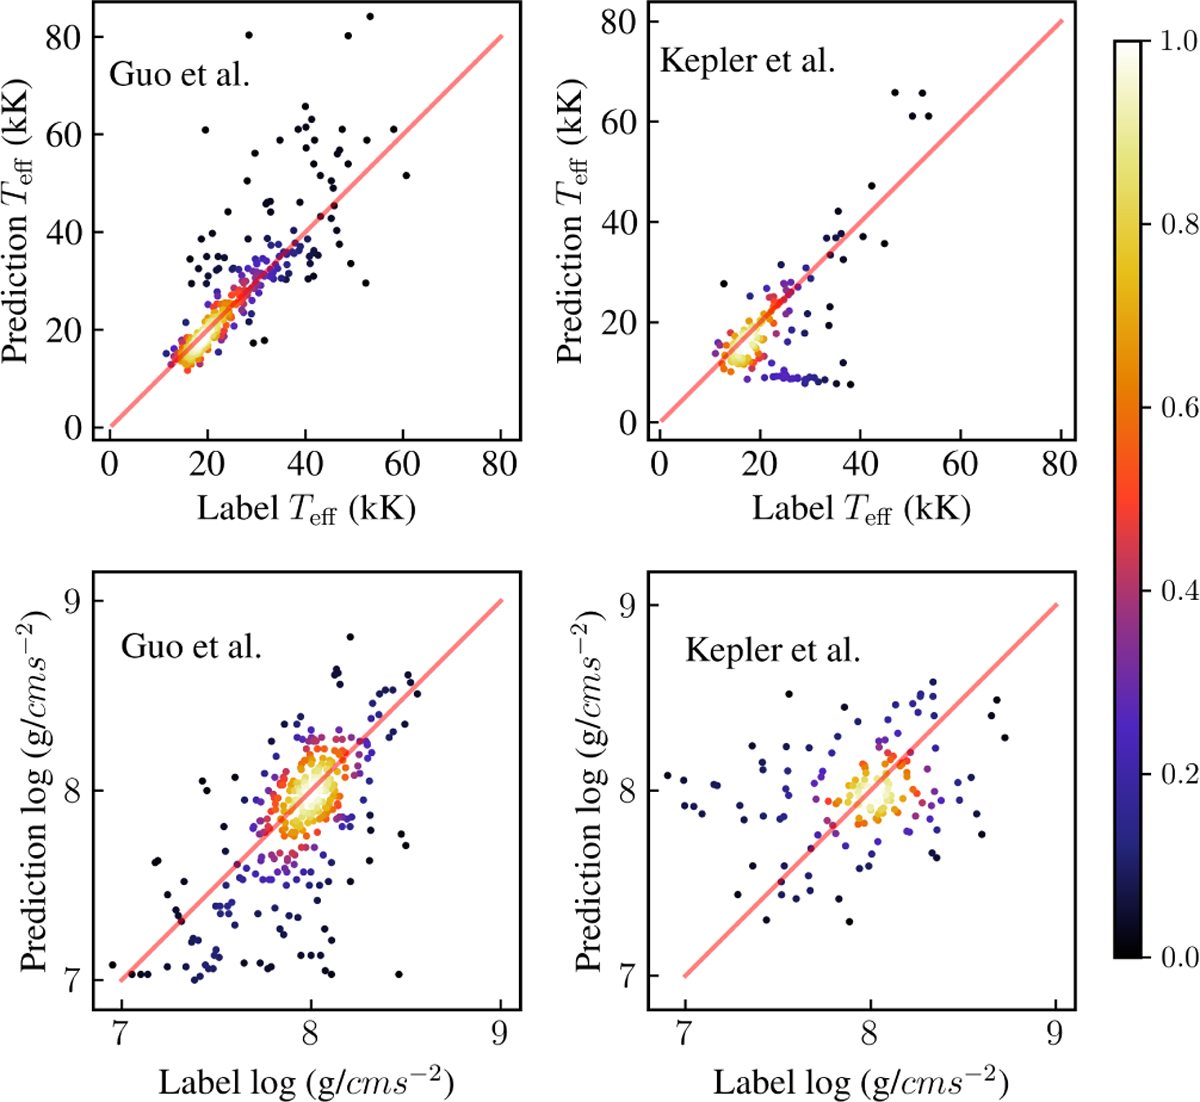
Comparison with traditional methods in predicting log g and Teff of white dwarfs. The first row shows the predictions for Teff, while the second row displays the predictions for log g. The first column compares our results with those of Guo et al. (2015), using data from LAMOST. The second column compares our results with those of Kepler et al. (2021), using data from SDSS. The scatter point density in the yellow region is higher than in the purple region. The red solid line represents the identity line. The scatter points are distributed around the identity line, indicating that the predictions of EstNet are consistent and effective compared to traditional methods.
Current usage metrics show cumulative count of Article Views (full-text article views including HTML views, PDF and ePub downloads, according to the available data) and Abstracts Views on Vision4Press platform.
Data correspond to usage on the plateform after 2015. The current usage metrics is available 48-96 hours after online publication and is updated daily on week days.
Initial download of the metrics may take a while.