Fig. 4
Download original image
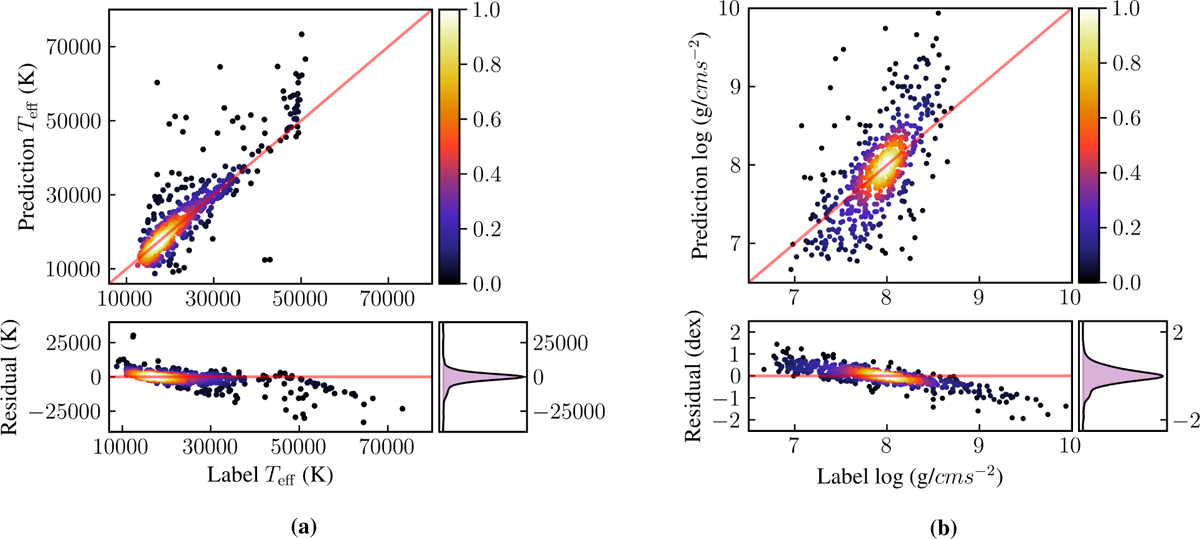
Estimation results. (a) Estimation results for Teff. (b) Estimation results for log g. The upper subplots in both figures show the kernel density plots of predicted values and true labels, with yellow areas indicating high-density regions. The lower subplots show the residual distribution between predicted values and true labels. The horizontal axis represents true labels, and the vertical axis represents residuals and predicted values. The red solid line represents the identity line.
Current usage metrics show cumulative count of Article Views (full-text article views including HTML views, PDF and ePub downloads, according to the available data) and Abstracts Views on Vision4Press platform.
Data correspond to usage on the plateform after 2015. The current usage metrics is available 48-96 hours after online publication and is updated daily on week days.
Initial download of the metrics may take a while.