Fig. 6
Download original image
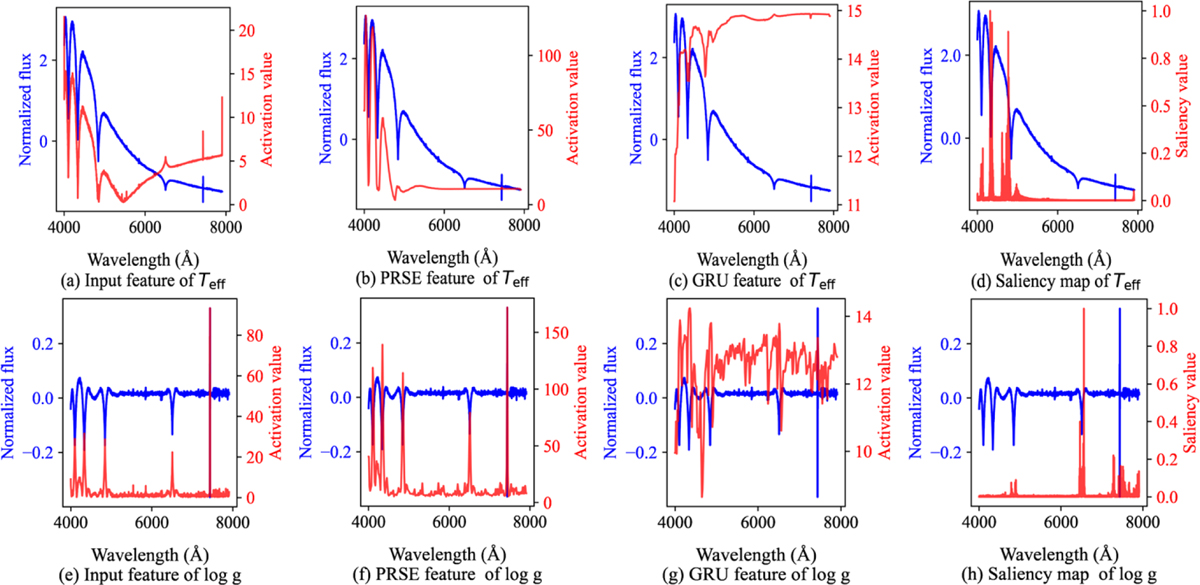
Features from different network stages and saliency analysis. (a–c) Comparisons of the feature spectra (red line) extracted from the input module, PRSE module, and GRU module with the input spectra (blue line) when estimating Teff. (d) Model’s output response to the input spectra (blue line) when estimating Teff and the red line is saliency curve. (e–g) Comparisons of the feature spectra (red line) extracted from the input module, PRSE module, and GRU module with the input spectra (blue line) when estimating log g. (h) Model’s output response to the input spectra (blue line) when estimating log g and the red line is saliency curve. The normalized flux refers to either min-max (top panels) or continuum normalization (bottom panels). In both cases, a subsequent Gaussian normalization is also applied. The observation ID of this spectrum is 254115228.
Current usage metrics show cumulative count of Article Views (full-text article views including HTML views, PDF and ePub downloads, according to the available data) and Abstracts Views on Vision4Press platform.
Data correspond to usage on the plateform after 2015. The current usage metrics is available 48-96 hours after online publication and is updated daily on week days.
Initial download of the metrics may take a while.