Fig. 8
Download original image
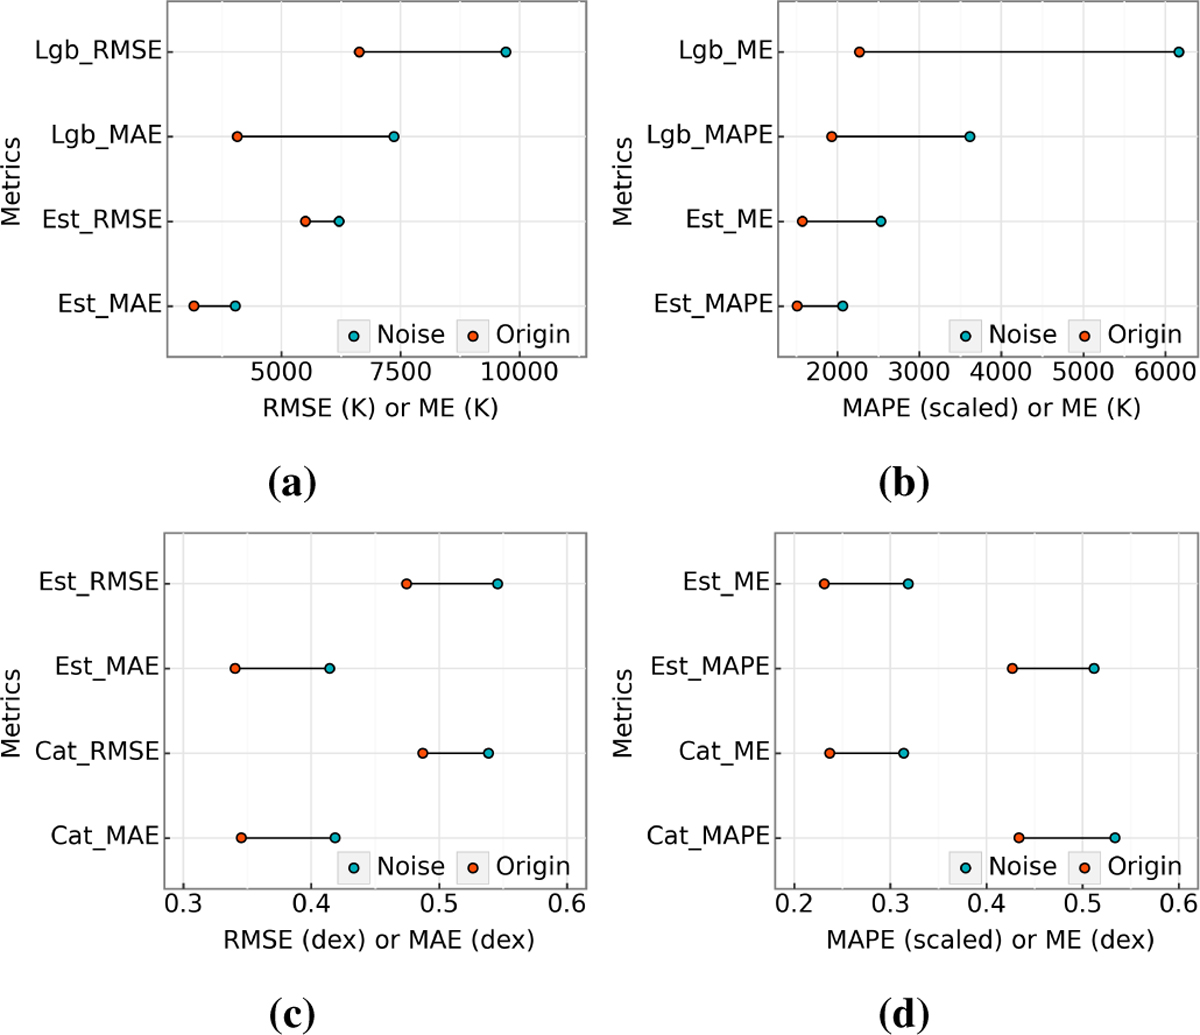
Dumbbell plots of metric fluctuations before and after adding noise. (a) Fluctuations in RMSE and MAE for Teff between LightGBM and EstNet34. (b) Fluctuations in MAPE and ME for Teff between LightGBM and EstNet34. (c) Fluctuations in RMSE and MAE for log g between CatBoost and EstNet66. (d) Fluctuations in MAPE and ME for log g between CatBoost and EstNet66. The red points represent the metrics before adding noise, and the blue points represent the metrics after adding noise. The lengths of the lines indicate the degree of fluctuation in the evaluation metrics before and after adding noise. In b and d, the MAPE values have been scaled to match the magnitude of ME to facilitate convenient visualization.
Current usage metrics show cumulative count of Article Views (full-text article views including HTML views, PDF and ePub downloads, according to the available data) and Abstracts Views on Vision4Press platform.
Data correspond to usage on the plateform after 2015. The current usage metrics is available 48-96 hours after online publication and is updated daily on week days.
Initial download of the metrics may take a while.