Fig. B.2.
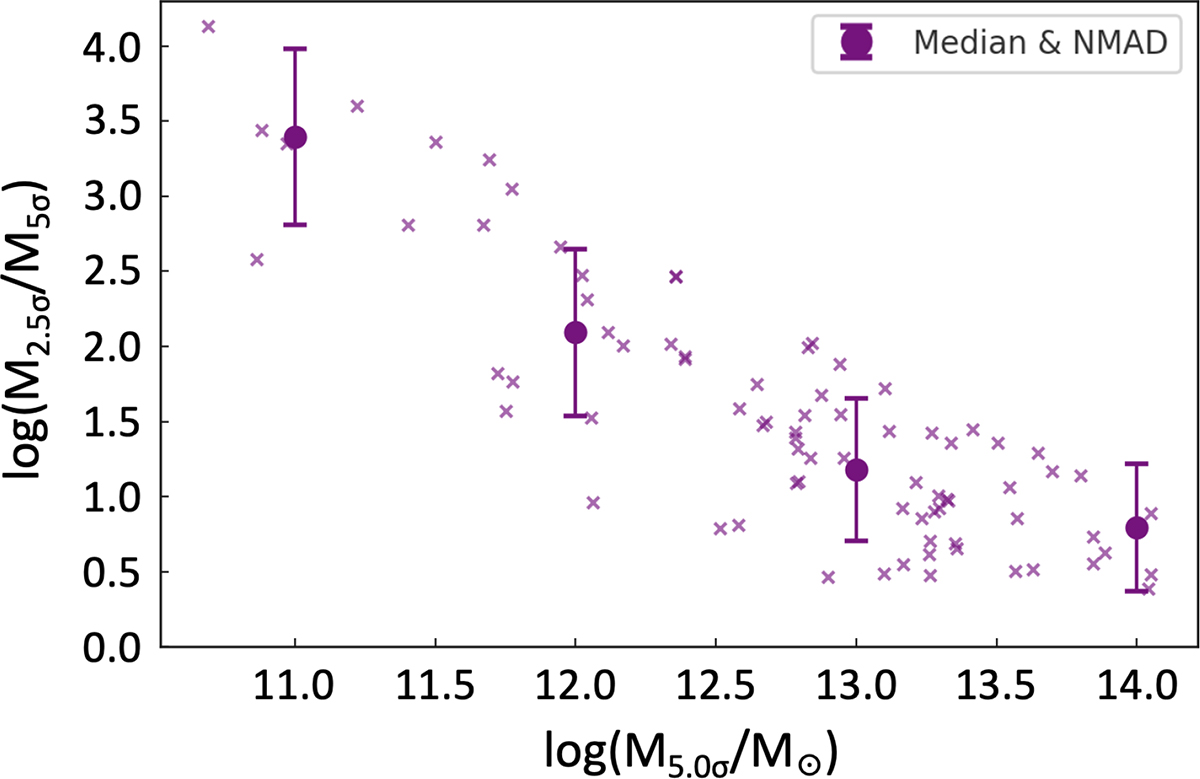
Download original image
Distribution of the total mass of 5σδ peak and the ratio of mass of 5σδ to their corresponding 2.5σδ envelopes (cross points). We divided the X-axis into bins of unit width. For each bin, the median value of mass-ratio is shown by filled purple circle. The error bars correspond to the NMAD of the points in the given bin. The plot shows that most of massive M5σδ > 12.8 reside much in protoclusters that have mass almost an order of magnitude higher compared to the M5σδ peaks.
Current usage metrics show cumulative count of Article Views (full-text article views including HTML views, PDF and ePub downloads, according to the available data) and Abstracts Views on Vision4Press platform.
Data correspond to usage on the plateform after 2015. The current usage metrics is available 48-96 hours after online publication and is updated daily on week days.
Initial download of the metrics may take a while.