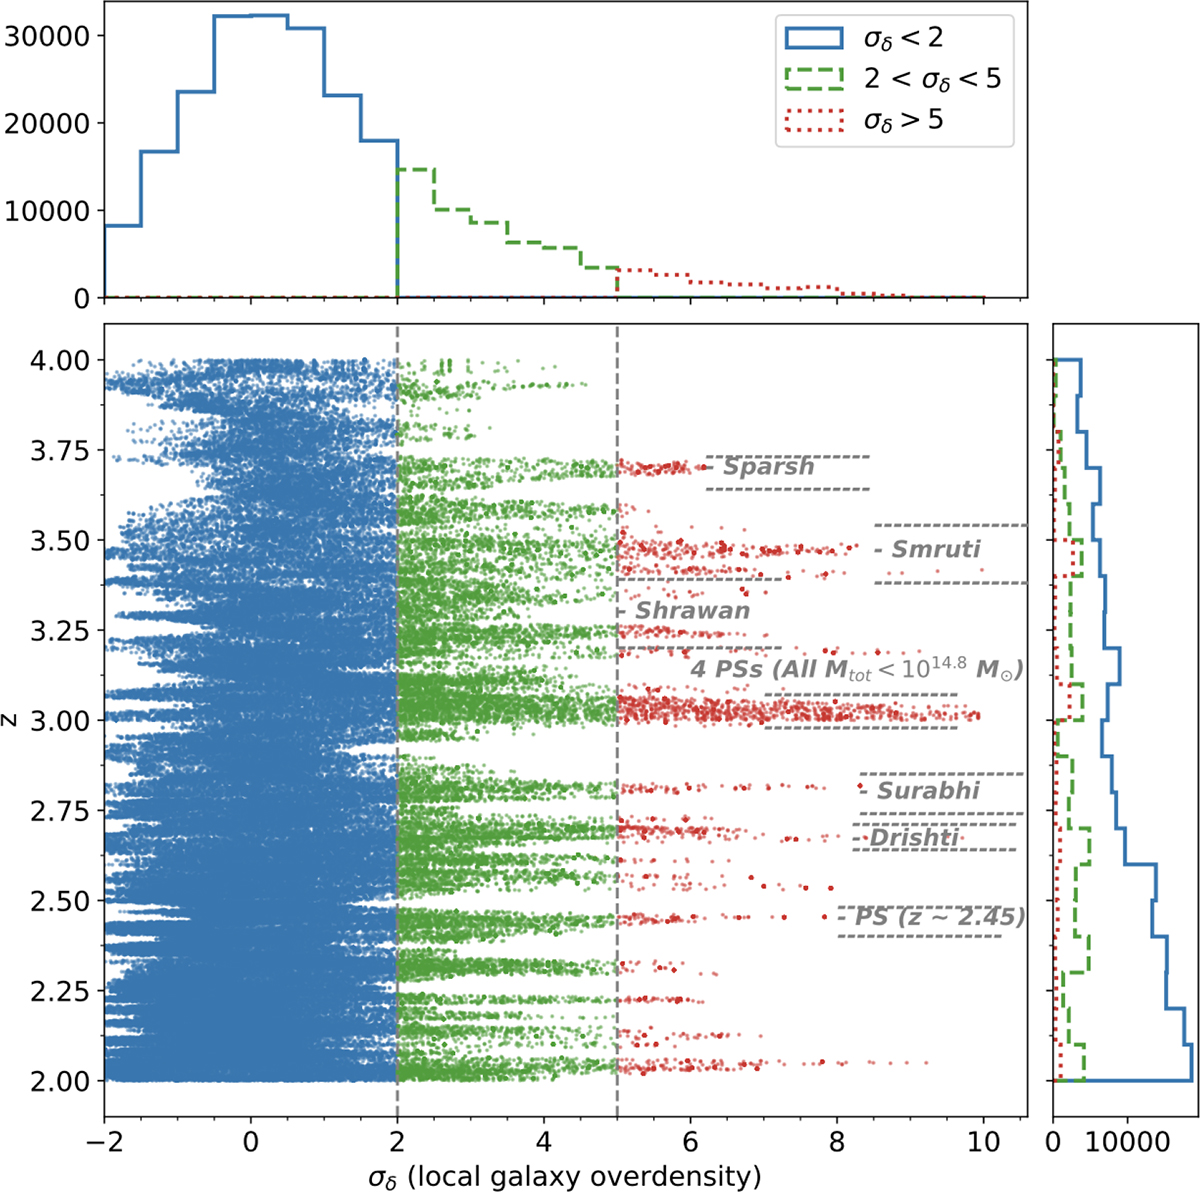
Fig. 3.
Download original image
Distribution of redshift vs. σδ (local galaxy overdensity) for 120 525 objects with 2.0 < zgal < 4.0 across the 100 Monte Carlo realizations. The number of objects is approximately 100 times higher than the true number of galaxies, averaging around 1205 objects per Monte Carlo iteration. The scatter points represent galaxies with their MC realization-specific local overdensity (σδ): coeval field (σδ < 2.0) (blue points), intermediate overdensities (2.0 < σδ < 5.0) (green points), and highly overdense peaks (σδ > 5.0) (red points). The histograms on top show the σδ distribution and the histograms on right show the redshift (zgal) for the three σδ bins: σδ < 2.0 (solid blue line), 2.0 < σδ < 5.0 (dashed green line), and σδ > 5.0 (dotted red line). The dashed gray lines show the division of the local overdensity in the three different bins used in our analyses. We also write the given names (gray text) of all five spectroscopically confirmed massive (Mtot ≥ 1014.8 M⊙) protostructures that are at z < 4 as presented in Shah et al. (2024) along with their redshift extent (horizontal dashed lines above and below the protostructure names). Furthermore, we also show the redshift of the most massive (Mtot = 1014.7 M⊙) protostructure in 2.0 < z < 4.0, which is located at z ∼ 2.45, and spread over 2.40 < z < 2.48. The broad horizontal stripe at z ∼ 3.05 consists of four protostructures, each less massive than those discussed in Shah et al. (2024). Likewise, the stripe at z ∼ 2.05 corresponds to a single protostructure with lower mass than the z ∼ 2.45 structure reported in this paper. Signs of these additional structures are visible in the figure above, but are not discussed in detail in Shah et al. (2024) or in the present paper due to their lower masses.
Current usage metrics show cumulative count of Article Views (full-text article views including HTML views, PDF and ePub downloads, according to the available data) and Abstracts Views on Vision4Press platform.
Data correspond to usage on the plateform after 2015. The current usage metrics is available 48-96 hours after online publication and is updated daily on week days.
Initial download of the metrics may take a while.