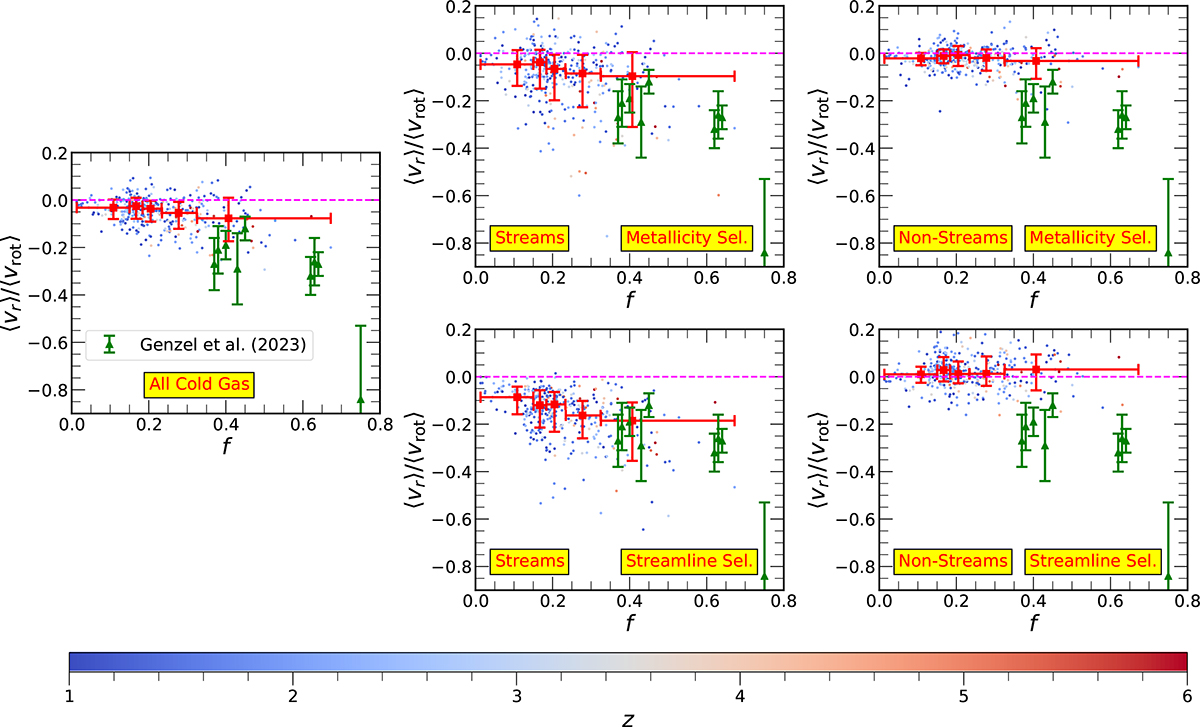
Fig. 14.
Download original image
Comparison of observations with the VELA disk galaxy sample. For all cold gas (left panel), streams (middle panels), and non-streams (right panels), ⟨Vr⟩/⟨Vrot⟩ is plotted as a function of the cold gas fraction (f). Each circle represents a snapshot from the VELA disk galaxy sample and is color coded by its corresponding redshift, z. Here, ⟨Vr⟩ denotes the stream-, non-stream-, or disk-averaged radial velocity, as relevant, and ⟨Vrot⟩ is the disk-averaged rotational velocity. Red squares indicate the median values within bins of f, with vertical error bars showing the 16th–84th percentile ranges and horizontal bars reflecting the bin widths. The horizontal position of each square corresponds to the average f within that bin. Results from the metallicity-based and streamline-based classifications are shown in the top and bottom rows, respectively. For comparison, observational data from Genzel et al. (2023) are represented by green diamonds with vertical error bars. These observations are consistent with the stream-averaged radial velocities obtained from the simulations (middle panels). In contrast, the disk-averaged (left panel) and non-stream-averaged (right panels) radial velocities are generally of much smaller magnitude and show limited agreement with the observed values.
Current usage metrics show cumulative count of Article Views (full-text article views including HTML views, PDF and ePub downloads, according to the available data) and Abstracts Views on Vision4Press platform.
Data correspond to usage on the plateform after 2015. The current usage metrics is available 48-96 hours after online publication and is updated daily on week days.
Initial download of the metrics may take a while.