| Issue |
A&A
Volume 704, December 2025
|
|
|---|---|---|
| Article Number | A1 | |
| Number of page(s) | 25 | |
| Section | Extragalactic astronomy | |
| DOI | https://doi.org/10.1051/0004-6361/202452095 | |
| Published online | 26 November 2025 | |
Radial transport in high-redshift disk galaxies dominated by inflowing streams
1
Racah Institute of Physics, The Hebrew University of Jerusalem, Jerusalem 91904, Israel
2
Santa Cruz Institute for Particle Physics, University of California, Santa Cruz, CA 95064, USA
3
Max-Planck-Institut für Extraterrestrische Physik (MPE), Giessenbachstraße 1, D-85748 Garching, Germany
4
Departments of Physics and Astronomy, University of California, Berkeley, CA 94720, USA
⋆ Corresponding author: This email address is being protected from spambots. You need JavaScript enabled to view it.
Received:
3
September
2024
Accepted:
29
September
2025
Abstract
Aims. We study the radial transport of cold gas within simulated disk galaxies at cosmic noon. Our aim is to determine whether disk instability or accretion along cold streams from the cosmic web is the driving mechanism behind the transport.
Methods. Disks were selected based on kinematics and flattening from the VELA zoom-in hydro-cosmological simulations. We mapped the radial velocity fields in the disks, computed their averages as a function of radius and over the whole disk, and obtained the radial mass flux in each disk as a function of radius. The transport directly associated with fresh incoming streams was identified by selecting cold gas cells that are either on incoming streamlines or have a low metallicity.
Results. We find the radial velocity fields in VELA disks to be highly non-axisymmetric, showing both inflows and outflows. However, in most cases, the average radial velocities, both as a function of radius and over the whole disk, were directed inward, with the disk-averaged radial velocities typically amounting to a few percent of the disk-averaged rotational velocities. This is significantly lower than the expectations from various models that analytically predict the inward mass transport to be driven by torques associated with disk instability. Under certain simplifying assumptions, such models typically predict average inflows of more than 10% of the rotational velocities. Analyzing the radial motions of streams and off-stream material, we find that the radial inflow in VELA disks is dominated by the stream inflows themselves, especially in the outer disks.
Conclusions. The high inward radial velocities inferred in observed disks at cosmic noon at the level of ∼20% of the rotational velocities may reflect motions along inflowing streams from the cosmic web rather than being generated by disk instability.
Key words: galaxies: high-redshift / galaxies: kinematics and dynamics
© The Authors 2025
 Open Access article, published by EDP Sciences, under the terms of the Creative Commons Attribution License (https://creativecommons.org/licenses/by/4.0), which permits unrestricted use, distribution, and reproduction in any medium, provided the original work is properly cited.
This article is published in open access under the Subscribe to Open model. This email address is being protected from spambots. You need JavaScript enabled to view it. to support open access publication.
1. Introduction
Extended self-gravitating star-forming highly-turbulent rotating disks dominate galaxy formation at cosmic noon, z ∼ 3 − 1 (e.g., Erb et al. 2004; Förster Schreiber et al. 2006, 2009; Genzel et al. 2006, 2008; Elmegreen et al. 2007; Kassin et al. 2007, 2012; Stark et al. 2008; Swinbank et al. 2012, 2017; Wisnioski et al. 2015, 2019; Stott et al. 2016; Simons et al. 2017; Übler et al. 2019), representing the peak of the star formation rate density in the Universe (Madau & Dickinson 2014). Disks at cosmic noon undergo various instabilities, collectively known as violent disk instabilities (VDI; e.g., Dekel et al. 2009a). Toomre (1964) showed that a self-gravitating rotating disk becomes gravitationally unstable when the Toomre-Q parameter, Q ∝ σκ/Σ, which represents the balance between self-gravity on the one hand (represented here by the gas surface density, Σ) and turbulent pressure and centrifugal support on the other hand (represented by the gas velocity dispersion, σ, and the epicyclic frequency, κ, respectively), becomes less than a critical value, Qc, of order unity. During the VDI phase, a disk can maintain a self-regulated, marginally unstable steady state with Q ∼ Qc (e.g., Dekel et al. 2009a; Krumholz & Burkert 2010; Cacciato et al. 2012; Genel et al. 2012a; Forbes et al. 2012, 2014; Krumholz et al. 2018; Ginzburg et al. 2022). If the disk becomes gravitationally unstable, the instabilities break axisymmetry and induce torques that lead to the transport of angular momentum radially outward, which is compensated by the inward migration of mass until marginal instability is restored. As mass moves radially inward down the potential well, the gravitational energy gained can be converted into turbulent energy, thereby maintaining the high levels of turbulence within the disk (Wada et al. 2002). In support of the above self-regulation mechanism, observed disks at cosmic noon also tend to have Q values on the order of unity (e.g., Genzel et al. 2011, 2014; Romeo & Falstad 2013; Obreschkow et al. 2015).
Radial mass transport driven by VDI can manifest in different ways. In Dekel et al. (2009a), clumps forming in a marginally unstable disk migrate inward due to torques from encounters with the off-clump material and other clumps (see also Cacciato et al. 2012). Multiple giant star-forming clumps have been observed in cosmic-noon disks (e.g., Elmegreen & Elmegreen 2005; Genzel et al. 2011; Shibuya et al. 2016; Huertas-Company et al. 2020; Ginzburg et al. 2021) and have also been found to emerge from the gravitational fragmentation of gas-rich disks in isolated as well as cosmological simulations (e.g., Noguchi 1999; Agertz et al. 2009; Genel et al. 2012b; Bournaud et al. 2014; Mandelker et al. 2014, 2017; Oklopčić et al. 2017). In addition, inward clump migration can be fueled by dynamical friction on the clumps from the off-clump material, as shown in Dekel et al. (2013).
Another mechanism is turbulent viscosity. According to Krumholz & Burkert (2010), turbulence can be modeled as an effective viscosity, which induces torques in a marginally unstable disk. The gravitational energy gained from the resulting inward mass transport balances the energy lost due to dissipation of turbulence such that an energy equilibrium is maintained (see also Goldbaum et al. 2015). Krumholz et al. (2018) extend the Krumholz & Burkert (2010) model by considering turbulence driven by both disk instability and supernova feedback, where energy lost due to dissipation of turbulence is balanced by both energy gained from supernova feedback and VDI-driven radial mass transport in a marginally unstable disk. They found that while supernova-feedback-driven turbulence is sufficient to explain the observed velocity dispersions in low-mass galaxies at low redshifts, disk-instability-driven turbulence is required at high redshifts (see also Forbes et al. 2012, 2014; Goldbaum et al. 2016). The Krumholz et al. (2018) model was extended by Ginzburg et al. (2022), who included an additional energy input from external accretion and showed that while supernova feedback is the main driver of turbulence in low-mass disks (halo masses < 1011.5 M⊙ at z ∼ 2), the primary driver of turbulence in high-mass disks is either external accretion or VDI-based radial mass transport, depending on the efficiency by which stream kinetic energy is converted to turbulent energy, which is treated as a free parameter (see also Elmegreen & Burkert 2010; Klessen & Hennebelle 2010; Genel et al. 2012a; Forbes et al. 2023).
Apart from clump migration and viscous disk transport, VDI-driven radial mass transport in cosmic-noon disks can also be caused by the inward migration of long-lived rings due to torques from the rest of the disk. As shown in Dekel et al. (2020), such rings can form via gravitational collapse in galaxies exhibiting a massive bulge.
For nearby galaxies, radial motions of a few kilometers per second have been consistently inferred using Hα/CO observations (Wong et al. 2004; Sellwood & Sánchez 2010; Schmidt et al. 2016; Speights et al. 2019). Similar studies in the distant Universe are difficult because of high resolution and signal-to-noise requirements. However, in a recent pioneering study, observational estimates of radial inflows in disks at cosmic noon were obtained by Genzel et al. (2023). Using high-resolution Hα/CO imaging spectroscopy of nine large well-resolved rotating disks between z ∼ 2.5 − 1, Genzel et al. (2023) inferred radially inward motions at the level of 50 − 100 km/s, or at least 20% of the rotational velocities, which seem to be in the ballpark of the model predictions based on VDI. However, there are large observational uncertainties in the analysis.
In this paper, we measure the radial transport of cold gas in cosmic-noon disks from the VELA zoom-in hydro-cosmological simulations (Ceverino et al. 2014; Zolotov et al. 2015) and compare it to analytical predictions from the VDI-driven radial mass transport models and the observational estimates of Genzel et al. (2023). The simulations incorporate gravity, Eulerian gas dynamics using an adaptive mesh refinement (AMR) scheme with a maximum AMR resolution of 17.5−35 pc in physical units at all times, and additional physics such as star formation, cooling, and feedback (see Sect. 2 for details). These simulations have been used to study many aspects of galaxy formation at cosmic noon (e.g., Ceverino et al. 2014, 2016a,b; Zolotov et al. 2015; Inoue et al. 2016; Tacchella et al. 2016a,b; Tomassetti et al. 2016; Mandelker et al. 2017; Dekel et al. 2020; Lapiner et al. 2023).
We recall that in massive halos at cosmic noon, cold gas from the cosmic web is funneled into hot halos through a few dominant filaments or streams, delivering it deep within the halo to the host galaxy (Birnboim & Dekel 2003; Kereš et al. 2005; Dekel & Birnboim 2006; Ocvirk et al. 2008; Dekel et al. 2009b; Pichon et al. 2011; van de Voort et al. 2011; Danovich et al. 2012, 2015; Nelson et al. 2013, 2015; Padnos et al. 2018; Mandelker et al. 2018; Aung et al. 2019; Mandelker et al. 2019, 2020). These streams likely play an additional role in driving the radial transport of cold gas in disks, directly by their inward velocities and/or indirectly by driving disk turbulence. This is expected to introduce deviations from cylindrical symmetry, which are not captured by the VDI models.
From investigations of the radial transport of cold gas in z ∼ 0 Milky Way (MW) mass disks using zoom-in hydro-cosmological simulations of the FIRE suite (Hopkins et al. 2014), Trapp et al. (2022) find that most of the freshly incoming gas piles up near the disk edge and does not contribute much to the radial mass flux within the disk. However, based on the analysis of MW halos from the Auriga suite of simulations (Grand et al. 2017), Okalidis et al. (2021) have shown that the accreted gas fraction can be large up to beyond 70% of the disk radius, leading to increased average radial inflow speeds in this region, which then subside to a constant value of ∼2 km/s in the inner disk. Cosmic noon disks may have an even higher stream penetrability, as they are fed by more intense streams (Dekel & Birnboim 2006; Dekel et al. 2009b). In fact, in an earlier observational study by Martin et al. (2019), radial motions in two z ∼ 2 Lyα emitting nebulae were found to be consistent with filamentary accretion-driven inflows. Here, using the VELA simulations, we measured the direct contribution of the streams to the radial transport of cold gas in simulated cosmic-noon disks. Distinguishing freshly incoming streams from the off-stream disk gas is non-trivial in an Eulerian simulation, and we resorted to crude stream identification techniques (see Sect. 5 for details). In a previous work, Martin et al. (2019) measured the radial inflow velocities in VELA 7 at z ∼ 2, finding them to be consistent with the observed motions in their sample of Lyα emitting nebulae. However, the analysis was restricted to one snapshot only, and no quantitative distinction between freshly incoming streams and off-stream material was made.
This paper is organized as follows. In Sect. 2, we describe the VELA simulations, define the main physical quantities of interest, and demonstrate our method for selecting rotation-supported disks. In Sect. 3, the radial transport of cold gas in the VELA disks is discussed, and in Sect. 4, these results are compared to expectations from the VDI-driven radial mass transport models. In Sect. 5, freshly incoming streams of cold gas are identified, and the radial transport of streams and off-stream material are separately quantified. In Sect. 6, the simulation results are compared to the Genzel et al. (2023) observations, and we summarize our work and conclude in Sect. 7.
2. Analyzing the simulations
We begin this section by briefly describing the VELA simulations (Sect. 2.1). Next, in Sect. 2.2, we introduce the main physical quantities of interest, particularly those relevant for characterizing radial transport. We end by demonstrating the selection of rotation-supported disks from the VELA simulation suite in Sect. 2.3.
2.1. VELA simulations
The VELA simulation suite consists of 34 hydro-cosmological zoom-in simulations of galaxies, typically evolved to z ∼ 1, with halo masses in the range of ∼1011 − 1012 M⊙ at z ∼ 2 (Ceverino et al. 2014, 2016a,b; Zolotov et al. 2015; Mandelker et al. 2017). The simulations are run with the Adaptive Refinement Tree (ART) code (Kravtsov et al. 1997; Kravtsov 2003; Ceverino & Klypin 2009), which accurately follows the evolution of a gravitating N-body system and Eulerian gas dynamics using an AMR scheme. The maximum AMR resolution of the simulations is 17.5−35 pc in physical units at all times. In addition to gravity and hydrodynamics, the simulations incorporate the physics of gas and metal cooling, UV-background photoionization, stochastic star formation, gas recycling, stellar winds and metal enrichment, thermal feedback from supernovae (Ceverino et al. 2010, 2012), and feedback from radiation pressure (Ceverino et al. 2014). The dark matter particles have a mass of 8.3 × 10⁴ M⊙, and stellar particles are formed with a minimum mass of 103 M⊙. (For further details on the simulation method and the VELA simulation suite in general, see Ceverino et al. 2010, 2014; Zolotov et al. 2015; Mandelker et al. 2017.)
2.2. Physical quantities
There are 1098 snapshots in total across all 34 galaxies, equally spaced in the cosmological expansion factor, a = (1 + z)−1, with Δa = 0.01. For each snapshot, the galactic center is determined iteratively using only the innermost stars (stars within spheres of decreasing radii from 600 to 130 pc, initially centered at the minimum of the potential well; for more details, see Mandelker et al. 2014). A “cold” disk is then defined using gas with temperatures less than 1.5 × 10⁴ K and stars with ages less than 100 Myr. The unit vector,  , along the angular momentum of this cold component (in its rest frame) determines the disk plane, i.e., the plane perpendicular to
  . The direction of
  , the disk radius, Rd, and disk height (half thickness), Hd, are computed iteratively until they converge to within 5%, following the procedure described in Appendix B of Mandelker et al. (2014). Briefly, Rd is defined such that it encloses 85% of the cold mass within a cylinder of radius 0.15Rv and height 1 kpc. Here, Rv is the virial radius of the dark matter halo hosting the galaxy, defined according to the Bryan & Norman (1998) critical overdensity criterion. Hd is defined such that the disk thickness, 2Hd, contains 85% of the cold mass within a cylinder of radius and height equal to Rd. The angular momentum of the cold material within a cylinder of radius Rd and height Hd determines
  . (See Mandelker et al. 2014 for more details.)
Except when otherwise stated, here onward, we focus on the cold gas within the disk, i.e., gas with temperatures less than 1.5 × 10⁴ K and residing within a cylinder of radius Rd and height Hd. This is for comparison to the Hα/CO observations of Genzel et al. (2023). However, we have verified that at least 80% (typically around 85 − 90%) of the gas mass in VELA disks is in the cold phase defined by this temperature threshold and that increasing the temperature threshold to include warm or hot gas with higher temperatures has no significant impact on our results (see also Appendix E). The ratio of the cold gas mass to the baryonic (gas + stars) mass within the disk is defined as the cold gas fraction, f. In Sect. 5, the cold gas within the disk is further classified into recently accreted streams versus the off-stream material, labeled as non-streams.
Two key physical quantities relevant to the study of radial transport are velocity and mass flux in the radial direction. These are determined for all cold gas as well as for streams and non-streams separately. The average radial velocity and radial mass flux as a function of the cylindrical distance from the galactic center, r, are defined as
 (1)
(1)
and
 (2)
(2)
respectively, where
 (3)
(3)
Here, vr, i and mi are the radial velocity and mass of the ith gas cell, respectively, and the sums are over cells containing all cold gas, streams, or non-streams, as relevant, in a cylindrical shell of radius r, width Δr, and height, Hd. N is the total number of relevant cells within this volume, and M is their combined mass. Both Vr and Fr are always quoted as dimensionless quantities. In the case of the former, this is achieved by computing its ratio with respect to Vrot, the average rotational velocity of all cold gas as a function of r, obtained from Equation (1) by replacing vr, i with vrot, i, the rotational velocity of the ith gas cell. Similarly, the latter is divided by ℳ/tdyn, where ℳ is the same as the cold gas M as a function of r, obtained from Equation (3), and tdyn = r/Vrot is the local dynamical time.
Another important physical quantity is the radial velocity dispersion of cold gas as a function of r, which is defined as
 (4)
(4)
where the sums are over all cold gas cells within a cylindrical shell of radius r, width Δr, and height Hd. Note that the second term in the expression under the square root is nothing but the cold gas, Vr, raised to the power of two.
By constructing ten equally spaced bins with Δr = 0.1Rd, the radial profiles of Vr, Vrot, and σr are obtained over the interval r = 0 to Rd. These are further mass-weighted averaged over r to give ⟨Vr⟩, the stream-, non-stream-, or disk-averaged radial velocity, as relevant, ⟨Vrot⟩, the disk-averaged rotational velocity, and ⟨σr⟩, the disk-averaged radial velocity dispersion.
2.3. Disk galaxy sample
From the 1098 snapshots, rotation-supported disks are selected by requiring that Rd/Hd > 3 and Vrot/σr > 1 at all r. The former is a reasonable cut to ensure a disk-like geometry, while the latter affirms a rotational support that is larger than the dispersion support at all r. This selection is both for comparison to disk-instability-based transport models, which are valid for rotation-supported disks, and also to the Genzel et al. (2023) sample of galaxies. The minimum ⟨Vrot⟩/⟨σr⟩ of our (selected) disk galaxy sample is around 1.5, while that of the Genzel et al. (2023) galaxies is 2. Our sample comprises 425 snapshots, about ∼39% of all VELA snapshots. In Fig. 1, ⟨Vrot⟩/⟨σr⟩, which is a measure of the disk-averaged rotational support in the galaxy compared to the disk-averaged dispersion support, is plotted against Rd/Hd for all VELA snapshots with the blue, round points. The red stars highlight the disk galaxy sample. The gray, dashed vertical and horizontal lines denote Rd/Hd = 3 and ⟨Vrot⟩/⟨σr⟩ = 1, respectively. Note the blue points with Rd/Hd > 3 and ⟨Vrot⟩/⟨σr⟩> 1 that are not in the disk galaxy sample, as they do not satisfy the condition Vrot/σr > 1 at all r. However, we have verified that including these snapshots in the disk sample makes no significant difference to our results.
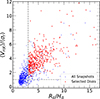 |
Fig. 1. Disk selection. The ratio of the disk-averaged rotational velocity to the disk-averaged radial velocity dispersion, ⟨Vrot⟩/⟨σr⟩, is plotted against the ratio of the disk radius to the disk height, Rd/Hd, for all 1098 snapshots belonging to 34 VELA galaxies with the round blue points. Of these, 425 snapshots satisfy the conditions Rd/Hd > 3 and Vrot/σr > 1 at all r, the distance from the galactic center in cylindrical coordinates, and they are selected as rotation-supported disks (highlighted by the red stars). Here, Vrot and σr are the average rotational velocity and the radial velocity dispersion of cold gas as a function of r, respectively. The gray dashed vertical and horizontal lines indicate Rd/Hd = 3 and ⟨Vrot⟩/⟨σr⟩ = 1, respectively. Some of the blue points with Rd/Hd > 3 and ⟨Vrot⟩/⟨σr⟩> 1 do not satisfy the condition Vrot/σr > 1 at all r. As such, they are not in the disk galaxy sample. |
3. Cold gas radial velocity and mass flux
In this section, we begin describing the radial transport of cold gas in the VELA simulations, focusing on the radial velocity and mass flux (see Sect. 2.2). In Sect. 3.1, we present an illustrative example. General trends with respect to the distance from the galactic center, cold gas fraction, and redshift are highlighted in Sect. 3.2.
3.1. An illustrative example
In Fig. 2, we demonstrate the radial transport of cold gas in one of the VELA galaxies, VELA 7, at a redshift of 1.5. At this epoch, the disk is quite large and thin (Rd = 18.43 kpc, Rd/Hd ∼ 9). It has a dominant rotational support with ⟨Vrot⟩/⟨σr⟩∼3 and a gas fraction of 0.18.
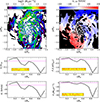 |
Fig. 2. Radial transport in a VELA disk. For the simulated galaxy VELA 7 at a redshift of z = 1.5, the top-left and -right panels show face-on maps of the cold gas surface density (Σ) and the two-dimensional radial velocity (vr,2D), respectively, within a region spanning 3 Rd × 3 Rd, centered on the galactic center. The disk is large (Rd = 18.43 kpc) and thin (Rd/Hd ∼ 9). It is mainly supported by rotation, with ⟨Vrot⟩/⟨σr⟩∼3 and has a cold gas fraction of f = 0.18. Regions with no cold gas are shown as white in the surface density map and black in the radial velocity map. Dashed red circles mark the radial extent of the disk. Both maps exhibit strong non-axisymmetry, largely due to incoming cold gas streams. The middle left and right panels display the average radial velocity (Vr, in units of Vrot) and the radial mass flux (Fr, in units of ℳ/tdyn), respectively, as functions of r, normalized by Rd, out to the disk radius. Here, Vrot and ℳ are the average rotational velocity and mass of all cold gas at r, and tdyn = r/Vrot is the local dynamical time. The non-normalized Vr and Fr are shown in the bottom left and right panels, respectively. Beyond roughly 0.2 Rd, both Vr and Vrot are negative and tend to grow in magnitude with increasing r, albeit with some fluctuations, indicating a predominantly inflow-driven cold gas radial transport within the disk. The disk-averaged radial velocity is also negative and has a magnitude about 8% of the disk-averaged rotational velocity. |
The top left and right panels, respectively, show the maps of face-on projected surface density, Σ, and radial velocity, vr,2D, for the cold gas in a region of dimensions 3 Rd × 3 Rd, centered on the galactic center. To obtain these maps, all relevant gas data (e.g., density, velocity, temperature) is first interpolated onto a uniform 3D grid with cell size, s = 0.01 Rd along each direction. Then, for a particular (x, y), Σ is obtained from the interpolated density field, ρ, by summing ρ × s over all cold gas cells between z = −Hd to Hd, where z = 0 represents the disk mid-plane. Similarly, vr,2D at a particular (x, y) is determined as the mass-weighted average of the interpolated radial velocity field, vr, between z = −Hd to Hd, only considering cold gas cells. Regions devoid of cold gas are shown with white and black patches in the surface density and radial velocity maps, respectively. The red, dashed circles indicate the radial extent of the disk.
We observe that both the radial velocity and surface density maps are highly non-axisymmetric, largely representing incoming streams of cold gas. At least two distinct streams can be visually identified in this galaxy, one inflowing into the disk (entering within Rd) from the top and the other from the bottom-right of the maps (in the vr,2D map, blue indicates inflows). In addition, most of the red, outflowing region in the bottom-left portion of the maps may be interpreted as a part of the former stream, en route to the apocenter after having crossed the pericenter. Streams are discussed in detail in Sect. 5. For now, just by looking at the maps, it suffices to say that a significant fraction of the cold gas mass within the disk is in streams with large radial velocities (positive or negative). Thus, they are likely to play a prominent role in the story of radial transport.
In the middle left and right panels, we, respectively, show the cold gas Vr (in units of Vrot) and Fr (in units of ℳ/tdyn) as functions of r (in units of Rd) out to the disk radius. The non-normalized Vr and Fr are depicted in the bottom left and right panels, respectively. Except within ∼0.2 Rd, Vr and Fr are both negative and generally increase in magnitude with an increase in r, though there are some oscillations. Vr is most negative near r = 0.8 Rd, attaining a value of −0.2 Vrot. Fr is also most negative at the same radius. The disk-averaged radial velocity, ⟨Vr⟩, is also negative and about 8% of the disk-averaged rotational velocity, ⟨Vrot⟩, in magnitude. Therefore, the radial transport of cold gas in the disk is inflow-dominated.
3.2. General trends
Having discussed a particular case, we now describe some general trends. In Fig. 3, the left and right panels, respectively, show the medians (solid lines) and 16th − 84th percentiles (envelopes) of cold gas Vr (in units of Vrot) and Fr (in units of ℳ/tdyn) as functions of r (in units of Rd) obtained from our disk galaxy sample. The median Vr and Fr are always negative and increase in magnitude with increasing r, except within ∼0.2 Rd, where the trends are reversed. While both Fr and Vr are positive at the 84th percentile for all r, their magnitudes at the 16th percentile are much larger. For example, at r = Rd, Vr at the 16th percentile is about −0.25 Vrot, while that at the 84th percentile is only ∼0.04 Vrot. Similarly, at the same radius, Fr at the 16th percentile is about five times larger in magnitude than that at the 84th percentile. Therefore, in a statistical sense, the radial transport of cold gas in our disk galaxy sample is inflow-dominated at all radii, i.e., the inflowing flux is larger in magnitude than the outflowing flux. This is also shown explicitly in the right panels of Figure 13.
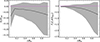 |
Fig. 3. Trends with distance from the galactic center. The left and right panels respectively show the medians (solid curves) and the 16th–84th percentile ranges (shaded regions) for the average radial velocity (Vr, in units of Vrot) and the radial mass flux (Fr, in units of ℳ/tdyn) as functions of r (in units of Rd) derived from our sample of disk galaxies. The median values of both Vr and Fr are consistently negative and become more negative with increasing r, except within approximately ∼0.2 Rd, where the trend reverses. Although the 84th percentile values of both Fr and Vr are positive at all radii, the magnitudes at the 16th percentile are substantially larger. Therefore, statistically speaking, the radial transport of cold gas across our sample is dominated by inflows at all radii. |
In Fig. 4, the ratio of the disk-averaged radial velocity to the disk-averaged rotational velocity, ⟨Vr⟩/⟨Vrot⟩, is plotted against f and z in the left and right panels, respectively, with the blue, round points. The red squares and the vertical error bars denote the medians and 16th − 84th percentiles, respectively, in f and z bins of varying widths (to include a sensible number of snapshots), as indicated by the horizontal error bars, with the locations of the squares along the f- and z-axes being at the bin-averages. We find that for most of the VELA disks (82%), ⟨Vr⟩ is negative, again highlighting the inflow-dominated nature of cold gas radial transport in our disk galaxy sample (note that ⟨Vrot⟩ is always positive). Also, on average, ⟨Vr⟩/⟨Vrot⟩ decreases (increases in magnitude) with an increase in both f and z, indicating that galaxies with larger cold gas fractions or at higher redshifts have higher levels of disk-averaged radial inflow in general. Both trends are relatively weak, though the one with cold gas fraction is more pronounced than that with redshift, the Spearman’s rank correlation coefficients in the two cases being −0.26 and −0.13, respectively.
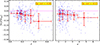 |
Fig. 4. Trends with cold gas fraction and redshift. The left and right panels show the ratio of the disk-averaged radial velocity to the disk-averaged rotational velocity, ⟨Vr⟩/⟨Vrot⟩, plotted as a function of the cold gas fraction (f) and redshift (z), respectively, using blue circles. Red squares represent the median values within bins of f and z (chosen to ensure adequate snapshot counts), while the vertical error bars correspond to the 16th–84th percentile ranges. The horizontal error bars indicate the bin widths, and the squares are placed at the mean values of f and z for each bin. For the majority of VELA disks (82%), ⟨Vr⟩ is negative (note that ⟨Vrot⟩ is strictly positive), underscoring the dominance of cold gas radial inflows over outflows in our disk galaxy sample. On average, ⟨Vr⟩/⟨Vrot⟩ becomes more negative with increasing f and z, suggesting that galaxies with higher cold gas content or located at higher redshifts typically exhibit stronger radial inflows. Although both correlations are relatively weak, the trend with cold gas fraction is stronger than that with redshift, as reflected in the Spearman rank correlation coefficients of −0.26 and −0.13, respectively. |
If the in-disk radial motions are driven by internal disk instabilities, a strong correlation is expected with gas fraction (and redshift, as gas fractions increase with increasing redshift). That we only see a weak correlation hints against this scenario, which is explored in more details in the next section. Trend in the radial motion with total cold gas mass in explored in Appendix D.
4. Disk-instability-based models of radial transport
Disk instability can induce gravitational torques that lead to angular momentum transport outward and mass transport inward. Below, we first summarize five different radial transport models based on disk instability (Sects. 4.1–4.3) and then compare their predictions for the inflow or inward migration velocity with the results from the VELA disk galaxy sample (Sect. 4.4).
4.1. Viscous disk transport
Krumholz & Burkert (2010, KB10 hereafter) and Krumholz et al. (2018, K18 hereafter) assume an axisymmetric disk of gas and stars that is always kept in a state of marginal instability. If the disk becomes gravitationally unstable, turbulence in the gas acts like viscosity, breaking axisymmetry and inducing torques that drive gas radially inward until marginal instability is restored. In addition, the gas disk is assumed to be in energy equilibrium, implying that the energy lost due to dissipation of turbulence is balanced by the energy gained from star formation feedback and input of gravitational energy from non-axisymmetric torques. Under these conditions, a steady-state solution for the gas mass inflow rate is given by
 (5)
(5)
Here, ℒ is the rate at which turbulent kinetic energy per unit area is dissipated, V is the circular velocity at radius, r, β = dlnV/dlnr, σ is the 1D gas velocity dispersion, assumed to be isotropic, and σsf is the value of σ that can be maintained with star formation feedback alone without any additional energy input from radial transport of gas (Ṁin = 0). Furthermore, Ṁin = 2 π r Σ Vin, where Σ and Vin are the gas surface density and inflow velocity, respectively. Therefore,
 (6)
(6)
Assuming the outer scale of turbulence to be of the order of the gas scale height, the turbulence decay rate per unit area in KB10 is given by
 (7)
(7)
where tcross = h/σ is the vertical crossing time, with h being the gas scale height at r. Further, assuming V/σ ∼ r/h, tcross = 1/Ω, where Ω = V/r is the angular velocity. A value of 3/2 was adopted for η, which corresponds to all the turbulent kinetic energy being radiated away every vertical crossing time. In addition, σ ≫ σsf was assumed, so the contribution to turbulent energy from star formation feedback is negligible. Substituting the above in Equation (6) and assuming a flat rotation curve (β = 0) gives
 (8)
(8)
In K18, the expression for the turbulence decay rate per unit area is
 (9)
(9)
where  is the 1D turbulent velocity dispersion of gas, with σth being the 1D thermal velocity dispersion, which is typically much smaller than σ, and
  . The gas scale height is estimated following Forbes et al. (2012):
 (10)
(10)
where G is the universal gravitational constant, Qg = κσ/(πGΣ), and Q* = κσ*/(πGΣ*), with σ* and Σ* being the stellar velocity dispersion and surface density, respectively, and  is the epicyclic frequency. Therefore,
 (11)
(11)
where Q is the two-component Toomre-Q parameter (see Romeo & Falstad 2013), expressed as Q = fg, QQg, where fg, Q depends on the gas and stellar surface densities and velocity dispersions (see Equation (9) in K18), ϕQ = 1 + Qg/Q*, and ϕnt = 1 − σth2/σ2. Using Equations (9) and (11),
 (12)
(12)
Substituting the expression for ℒ from Equation (12) in Equation (6) and adopting the fiducial values for β, fg, Q, ϕQ, ϕnt, and η as in K18, namely, β = 0, fg, Q = 0.5, ϕQ = 2, ϕnt = 1, and η = 1.5 gives
 (13)
(13)
Additionally, if σ ≫ σsf (σsf ≃ 10 km/s, see K18) and the contribution to turbulent energy from star formation feedback can be neglected, the above equation can be further simplified to give
 (14)
(14)
We note that the difference in the KB10 and K18 expressions for Vin (Equations (8) and (14)) arises from the different approximations for the gas scale height, which lead to a Q dependence in the scale height crossing time for the K18 model as opposed to no Q dependence in the KB10 model. If the K18 approximation for the gas scale height (Equation (10)) were to be also adopted for the KB10 model, then the two models would yield identical expressions for Vin. (For more details on these models, see KB10 and K18.)
4.2. Ring migration
In this subsection and the next, we assume an axisymmetric gas disk maintained at marginal instability, with an average surface density, Σd; disk radius, Rd; and a flat rotation curve with circular velocity,
 (15)
(15)
where Mtot is the total mass (including the gas disk, stars, and dark matter) within Rd. The disk mass within Rd is given by
 (16)
(16)
The average Toomre-Q parameter for the disk can be expressed as
 (17)
(17)
where σ is the average 1D gas velocity dispersion, assumed to be isotropic; the angular velocity is approximated as
 (18)
(18)
and δd is defined as Md/Mtot. For marginal instability, Q is on the order of unity, with an exact value that depends on the disk thickness.
In Dekel et al. (2020, D20 hereafter), the authors found that a long-lived ring of gas can form in a galaxy exhibiting a massive bulge. Once formed, a ring at radius r of width Δr migrates inward due to non-axisymmetric torques from the rest of the disk on a time scale of
 (19)
(19)
which is calculated assuming a tightly wound spiral structure with m arms (see Equation (23) in D20). Here, ηr = Δr/r is the relative width of the ring; Δr = Σr/Σd is the ring contrast with respect to the disk, with Σr being the average ring density; and Am is the fraction of the disk density that is in the spiral arm perturbation. Assuming tin = r/Vin and replacing δd using Equation (17), Equation (19) can be simplified to give
 (20)
(20)
where we have adopted the fiducial values for m, Δr, Am, and ηr from D20, namely, m = 2, Δr = 1, Am = 0.5, and ηr = 0.5. (For more details on this model, see D20).
4.3. Clump migration
Due to gravitational instability, gas-rich disks can fragment into giant clumps. As shown in Dekel et al. (2009a, DSC09 hereafter), torques from the off-clump disk mass and clump-clump encounters can cause the clumps to migrate inward on a time scale of
 (21)
(21)
Assuming tin = Rd/Vin and replacing δd using Equation (17), Equation (21) can be simplified to give
 (22)
(22)
(For more details on this model, see DSC09.)
Inward clump migration can also occur due to dynamical friction on a clump from the off-clump disk mass (Dekel et al. 2013, D13 hereafter). According to Chandrasekhar’s dynamical friction formula, the deceleration due to dynamical friction on a clump of mass Mc moving in a circular orbit with velocity V is given by
 (23)
(23)
where lnΛ is the Coulomb logarithm and ρd is the off-clump disk density. Following DSC09 and using Equations (15), (16), and (18), the pre-collapse radius of a typical clump is
 (24)
(24)
and the clump mass is
 (25)
(25)
Assuming Hd/Rd ∼ σ/V, where Hd is the disk height and using the definition of Q as in Equation (17),
 (26)
(26)
Therefore,
 (27)
(27)
Substituting ρd and Mc in Equation (23) gives
 (28)
(28)
and therefore the clump migration time is
 (29)
(29)
Assuming tin = Rd/Vin, the inward migration velocity of clumps due to dynamical friction is given by
 (30)
(30)
where following D13, we adopted lnΛ = 2, and Equation (17) is used to replace δd. (For more details on this model, see D13.)
4.4. Comparison with simulations
In Fig. 5, the predictions for the radial inflow velocity from the models discussed above are compared against the results from the VELA simulations. For each snapshot in our disk galaxy sample, ⟨Vr⟩/⟨Vrot⟩ is plotted against ⟨Vrot⟩/⟨σr⟩ with the blue, round points. The red squares and the vertical error bars denote the medians and 16th − 84th percentiles, respectively, in ⟨Vrot⟩/⟨σr⟩ bins of varying widths, as indicated by the horizontal error bars, with the locations of the squares along the ⟨Vrot⟩/⟨σr⟩ – axis being at the bin-averages. The different curves show the inflow velocity predictions from the disk-instability-driven models of radial transport, as labeled, with Q = 0.68 (marginal instability condition for thick disks; Goldreich & Lynden-Bell 1965) in the left panel and Q = 1 (marginal instability condition for thin disks) in the right panel.
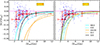 |
Fig. 5. Comparison of disk-instability-based radial transport models with simulations. For each snapshot in our disk galaxy sample, ⟨Vr⟩/⟨Vrot⟩ versus ⟨Vrot⟩/⟨σr⟩ is plotted using blue circles. Red squares represent the medians within bins of ⟨Vrot⟩/⟨σr⟩ of varying widths, selected to ensure a reasonable number of snapshots per bin. Vertical error bars indicate the 16th–84th percentile ranges, and horizontal error bars show the bin widths. The red squares are positioned at the average ⟨Vrot⟩/⟨σr⟩ for each bin. Overlaid curves correspond to predictions from disk-instability-based models of radial inflow, as labeled. The left panel adopts Q = 0.68 (marginal instability for thick disks; Goldreich & Lynden-Bell 1965), and the right panel uses Q = 1 (marginal instability for thin disks). The D20 model describes inflow via ring migration, while the DSC09 and D13 models focus on clump migration. The KB10 and K18 models consider global gas transport in viscous disks and are likely the most applicable for comparison with the analysis of the VELA disks presented in this paper. It is worth noting that for most VELA disks, these two models tend to overestimate the disk-averaged radial inflow, regardless of whether Q = 0.68 or Q = 1 is assumed. Furthermore, all five models consistently predict radial inflows, whereas about 18% of the VELA disks show disk-averaged outflows. |
In the simulations, on average, ⟨Vr⟩/⟨Vrot⟩ decreases in magnitude as ⟨Vrot⟩/⟨σr⟩ increases. While the different models reflect this general trend, they typically produce higher levels of radial inflow than observed in the simulations. With Q = 0.68 (left panel), for ⟨Vrot⟩/⟨σr⟩≲5, all the models predict significantly higher radial velocities (in magnitude) than generally found in the VELA simulations. For ⟨Vrot⟩/⟨σr⟩> 5, however, the D20 and KB10 models agree with the simulations. But, there are very few galaxies with such high ⟨Vrot⟩/⟨σr⟩ (only about 20%). With Q = 1 (right panel), the different model curves are closer to the simulated points, but still, for ⟨Vrot⟩/⟨σr⟩≲5, where most of the simulated points lie, only the D20 model is in good agreement with the simulations. However, in the case of ⟨Vrot⟩/⟨σr⟩> 5, all the models with Q = 1 agree with the simulations.
As noted earlier, the D20 model specifically concerns the migration of thin rings, but the fraction of VELA disks with strong rings is small (≲30%, see D20). The DSC09 and D13 models apply to the migration of clumps. However, we have verified that the radial mass flux in the VELA disks is dominated by the off-clump material. Therefore, the KB10 and K18 models, which deal with global gas transport in viscous disks, may be the most relevant for us. From Fig. 5, we can safely conclude that for most of the VELA disks, irrespective of whether Q is assumed to be 0.68 or 1, both these models overpredict the magnitudes of the disk-averaged radial inflow velocities compared to that found in the simulations (see also Appendix C, which shows that the same is true for the locally averaged inflow at different radii as well). We also emphasize that all five models predict radial inflows, whereas occasionally (in about 18% cases), disk-averaged outflows can be seen in the VELA simulations.
5. Streams
As seen in Fig. 2, the VELA galaxies are fed by non-axisymmetric streams of cold gas, which can penetrate well within the disk. As such, much of the radial mass flux and velocity associated with the VELA disks could well be dominated by the motion of recently accreted streams rather than being generated by disk instability. To ascertain if this is indeed the case, we first compare the radial mass flux at the boundary of VELA disks (in a cylindrical shell of radius r = Rd, width Δr = 0.1Rd, and height, Hd) to the cold gas accretion rate at the disk boundary predicted by a simple “bathtub” model (e.g., Bouché et al. 2010; Dekel & Mandelker 2014) in steady state, where the star formation rate in the disk is balanced by the accretion rate, ignoring any mass inflows through the disk onto the central bulge or mass outflows (Sect. 5.1). We then discuss how streams are identified in the VELA disks (Sect. 5.2) and quantify the radial transport of streams and off-stream cold gas, labeled as non-streams, separately. We highlight a particular example in Sect. 5.3 and discuss the overall statistics from the VELA disk galaxy sample in Sect. 5.4.
5.1. Radial mass flux versus accretion rate from bathtub model
Assuming mass conservation, the total cold gas mass, Md, within a disk varies according to
 (31)
(31)
where Ṁac is the accretion rate of cold gas at the disk edge and Ṁsf is the star formation rate, crudely approximated as
 (32)
(32)
where τsf = tff/ϵsf. Here, tff is the free-fall time, and ϵsf is the star formation efficiency. Note that while deriving Equation (31), we neglected all sink terms other than star formation, such as disk-instability driven mass inflows through the disk onto the central bulge and outflows driven by stellar feedback.
If Ṁac and  are slowly varying with time scales that are longer than τsf, Equations (31) and (32) can be easily solved to give
 (33)
(33)
After a transition period of order τsf, the above equation relaxes to a steady-state solution given by
 (34)
(34)
Therefore,  .
.
Following D13, we estimated tff as tff = fsftd, where fsf ∼ 0.5, assuming that star formation occurs in clumps where the overdensity is a factor of a few with respect to the average disk density and
 (35)
(35)
is the disk dynamical time. Here, λ is the halo spin parameter relating the disk radius, Rd, to the halo virial radius, Rv, and υ is the ratio between the disk rotation velocity, V, and the halo virial velocity, Vv. In addition, the redshift dependent relations for Rv and Vv, Rv/Vv = 0.14t, where t is the cosmological time, are used. Adopting λ ∼ 0.05, υ ∼ 1, and ϵsf ∼ 0.02, we get
 (36)
(36)
where we used the relation 1/a = (t/t1)−2/3, with t1 = 17.5 Gyr (see D13). For comparison, the cosmological specific accretion rate of baryons at the halo boundary is given by
 (37)
(37)
with s = 0.03 Gyr−1, which was also derived in D13 and shown to be in good agreement with earlier VELA-like simulations.
In Fig. 6, the cold gas radial mass flux at Rd, Fr = Rd, divided by Md is shown as a function of the scale factor a for our disk galaxy sample, with the solid black line and the envelope indicating the median and the 16th − 84th percentile variation over a bins of width 0.07. The brown, dot-dashed line plots Ṁac/Md as a function of a according to Equation (36). For comparison, the blue, dotted line also indicates Ṁb/Mb as a function of a according to Equation (37). The good agreement between the median trend in Fr = Rd/Md and Ṁac/Md from the bathtub model, shows that on average, the cold gas radial mass flux at the edge of VELA disks is consistent with that expected from accretion onto the disk. In the following subsections, we show that in VELA disks, the accreted cold gas streams can penetrate well within the disk, such that the radial mass flux in the outer disks (r ≳ 0.5Rd) is largely dominated by stream motions.
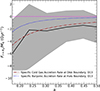 |
Fig. 6. Cold gas radial mass flux versus bathtub model prediction. For the VELA disk galaxy sample, the cold gas radial flux mass at Rd, Fr = Rd, divided by the total cold gas mass within Rd, Md, is plotted as a function of the scale factor, a, with the solid black line and the envelope indicating the median and 16th − 84th percentile variation over a bins of width 0.07. The brown dot-dashed line highlights the specific accretion rate of cold gas at the disk edge, predicted by a steady-state bathtub model and ignoring any disk-instability driven mass inflows through the disk onto the central bulge or feedback-driven outflows (see D13). For comparison, the cosmological specific accretion rate of baryons onto the halo, also derived in D13, is shown with the blue, dotted line. The good agreement between the black and the brown curves highlights the importance of accreted cold gas in explaining the dynamics of VELA disks. |
5.2. Stream selection
The identification of gas in incoming streams is not a trivial task given the Eulerian nature of the VELA simulations and the absence of gas particles that trace the flows. We, therefore, appeal to two different crude procedures for selecting grid cells that belong to recently incoming streams, one using gas metallicities and the other using streamlines, as follows.
5.2.1. Metallicity-based selection
Streams, due to their recent accretion onto the galaxy, are likely to have relatively low metallicities. Therefore, in a crude way, we can use a threshold metallicity, Zcut, to separate streams from the rest of the cold gas. To determine this metallicity threshold for a particular snapshot, we first find the mass-weighted cold gas metallicity distribution outside the disk radius, between r = Rd to 2Rd and z = −Hd to Hd, and then select the 99th percentile of this distribution as Zcut. Our results are robust against the particular choice for this threshold, as adopting Zcut to be the 90th or 95th percentile instead of the 99th has no significant impact (see Appendix B). Cold gas with Z < Zcut at any r is classified as streams and the rest as non-streams. The inherent assumption made in this selection procedure is that almost all the cold gas beyond Rd is in the form of recently accreted streams. Therefore, the maximum metallicity of this gas is the maximum metallicity of streams and can be used as a threshold to distinguish between streams and non-streams within the disk. Note that here we ignore the possibility that the gas beyond Rd may also have a metal-enriched, outflowing cold component ejected by stellar winds and supernovae (e.g. Veilleux et al. 2020), which can potentially bias this selection. However, the inflowing cold streams may themselves have higher metallicities because of the entrainment of initially hot, recycled, enriched gas that has been previously ejected from the galaxy (Strawn et al. 2021; Aung et al. 2024).
To give an example, in Fig. 7, the left panel shows the 2D metallicity map, Z2D, for VELA 7 at z = 1.5 in a face-on projection of dimensions 4Rd × 4Rd, centered on the galactic center, obtained after mass-weighted averaging the metallicites (Z) of the cold gas cells along the z-axis between −Hd to Hd. The red and cyan, dashed circles have radii equal to Rd and 2Rd, respectively. The image shows an overall negative metallicity gradient from small to large r, i.e., metallicity decreases as the cylindrical distance from the galactic center increases. This is consistent with the assumption that the cold gas outside the disk (r ≳ Rd) likely consists almost entirely of low-metallicity streams, whereas that within the disk (r ≲ Rd) is a mix of both streams and non-streams. In the right panel, the mass-weighted histogram of Z for all cold gas cells between r = Rd to 2Rd and z = −Hd to Hd is shown, normalized by the total cold gas mass inside this region. The black, dashed vertical line at Z = 0.009 indicates Zcut, the 99th percentile of this distribution, and the threshold metallicity that separates streams from non-streams.
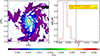 |
Fig. 7. Metallicity-based selection of streams. The left panel presents the two-dimensional metallicity distribution (Z2D) for the VELA 7 galaxy at a redshift of z = 1.5, shown in a face-on orientation spanning 4Rd × 4Rd and centered on the galactic center. This map was derived by computing the mass-weighted average of the cold gas metallicities (Z) along the z-axis within the vertical range of −Hd to Hd. Overlaid on the map are dashed red and cyan circles representing radii of Rd and 2Rd, respectively. The image reveals a general decline in metallicity with increasing radial distance, indicating a negative metallicity gradient. The right panel displays the mass-weighted histogram of Z for cold gas cells located between r = Rd and r = 2Rd and vertically between z = −Hd and z = Hd normalized by the total mass of cold gas in the specified volume. The black dashed vertical line at Z = 0.009 marks the 99th percentile of this distribution and serves as the threshold metallicity, Zcut, used to distinguish between stream gas (Z < Zcut) and non-stream gas (Z > Zcut). This stream selection procedure is based on the assumption that the vast majority of cold gas located beyond Rd originates from recently accreted streams. |
5.2.2. Streamline-based selection
Alternatively, we try to identify streams by tracing the path of each cold gas cell back in time. For simplicity, we assume that the gas velocity field remains stationary during the time over which we trace back the flow. Therefore, path lines are the same as instantaneous streamlines, and cold gas cells in a given snapshot can be traced using the gas velocity data of that snapshot only. The tracing time, ttrace, is adopted to be the average disk dynamical time, ttrace = Rd/⟨Vrot⟩. Starting from its current 3D position, rt, at time, t, a cold gas cell in a given snapshot is traced back in time along its path line (i.e., the streamline that originates from this position) to yield its initial 3D position, ri, at time t − ttrace. As streams are recently accreted material, the cells which move inward over ttrace, i.e., |ri|> |rt|, and by sufficiently large distances, i.e., d = |rt − ri|> dcut, are classified as streams. The rest are classified as non-streams. By trial and error, we choose dcut = 0.1Rd, such that most cold gas cells that visually appear to be a part of streams get correctly identified by this procedure. Changing dcut by a factor of two up or down has no significant impact on our results (see Appendix B). We note that the streamline-based selection is biased toward detecting only inflowing material as streams, while the metallicity-based selection does not have this bias.
As an example, for VELA 7 at z = 1.5, the path lines of a random selection of cold gas cells within the disk, traced back in time over the interval ttrace and projected onto the x-y plane, are shown in Fig. 8, separated into streams (left panel) and non-streams (right panel). The path lines of all cold gas cells within the disk are not shown for better clarity. The lines are color coded by ±d, in units of Rd, with positive values indicating the cases where |ri|> |rt| and negative values showing the opposite. The red circles denote the radial extent of the disk. We note that most of the path lines in the left panel can be divided into two distinct groups, both having large positive d values, indicating the inflow of cold gas either from the top or bottom-right of the image, which then spiral onto the galaxy counter-clockwise. The two groups also broadly coincide in space with the regions of the galaxy that can be visually identified as two distinct streams in the radial velocity and surface density maps (see the top left and right panels of Fig. 2). On the other hand, the path lines in the right panel either have d ≈ 0 (greenish lines), indicating little or no displacement over ttrace, or have large negative d values, indicating outflowing cold gas.
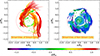 |
Fig. 8. Streamline-based selection of streams. For the VELA 7 galaxy at a redshift z = 1.5, the figure displays path lines for a randomly selected subset of cold gas cells within the galactic disk traced backward over an average disk dynamical time scale, defined as ttrace = Rd/⟨Vrot⟩ and projected onto the x–y plane. These path lines are shown separately for streams (left panel) and non-streams (right panel). To enhance visual clarity, only a portion of the cold gas cells within the disk are included. The path lines are color coded by ±d, where d represents the distance a gas cell has traveled during ttrace, normalized by Rd. Positive values of d indicate inward motion (i.e., the 3D radius at t − ttrace is larger than at the present time), while negative values signify outward movement. Red dashed circles mark the radial boundary of the disk. A threshold value of dcut = +0.1Rd is used to distinguish inflowing streams from non-streaming gas. Most stream-classified cells (left panel) cluster into two spatially coherent inflowing structures, both showing large positive d values and entering the disk either from the top or bottom-right regions of the projection. In contrast, cells labeled as non-streams (right panel) either show minimal displacement over ttrace (d ≈ 0) or exhibit outward motion with significantly negative d values. |
5.3. Stream and non-stream signal: An example
In Figs. 9 and 10, we compare the face-on radial velocity (top rows) and surface density (bottom rows) maps of streams and non-streams, respectively, obtained with the metallicity- (middle panels) and streamline-based (right panels) selections for VELA 7 at z = 1.5. These maps are generated following the procedure outlined in Sect. 3.1, except that instead of all cold gas cells, only cells identified as streams or non-streams are used, as relevant. To check the results of the two selections against what visually appears as streams, the face-on radial velocity and surface density maps of all cold gas in a slightly larger region of dimensions 3Rd × 3Rd, as shown in the top right and left panels of Fig. 2, are re-plotted here in the top and bottom left panels, respectively. Note that the actual classification of cold gas cells into streams and non-streams is only done within the disk (i.e., within a cylinder of radius Rd and height Hd), as shown in the middle and right panels. The red, dashed circles indicate the radial extent of the disk.
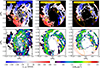 |
Fig. 9. Stream maps: The left, middle, and right panels respectively present the face-on maps of radial velocity (top row) and surface density (bottom row) in VELA 7 at z = 1.5, corresponding to all cold gas, streams identified via the metallicity-based method, and streams identified via the streamline-based method. To aid visual recognition of streams, the maps in the left panels are shown over an expanded area of 3Rd × 3Rd. However, the actual classification of cold gas into streams and non-streams is confined to the galactic disk, defined as a cylinder with radius Rd and height Hd, as shown in the middle and right panels. Red dashed circles denote the radial extent of this disk. In the left panels, two distinct inflowing cold gas groups are apparent (blue in the vr,2D map indicates inward motion), entering within Rd either from the top or the bottom-right and subsequently spiraling counter-clockwise toward the galactic center. The metallicity- and streamline-based classifications select somewhat different portions of these inflowing groups as streams. The areas enclosed by the orange ellipses (labeled a, b, and c) correspond to the main regions of disagreement between the two classification methods; these discrepancies are discussed further in Sect. 5.3. |
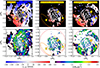 |
Fig. 10. Non-stream maps. Same as in Fig. 9 except the middle and right panels now show the face-on radial velocity (top row) and surface density (bottom row) maps of the off-stream material obtained with the metallicity- and streamline-based selections, respectively. As seen in Figure 9, the metallicity- and streamline-based selections identify somewhat different regions of the cold gas as streams, automatically resulting in different non-stream identifications. The regions marked with the orange ellipses (a, b, and c) are the primary sources of disagreement between the two classification methods as discussed in Sect. 5.3. |
As visually identified earlier in Fig 2, there are two distinct groups of incoming cold gas (blue indicates inflows in the vr,2D map), one entering within Rd from the top (Group I) and the other from the bottom-right (Group II) of the maps, which then spiral onto the galaxy counter-clockwise. Because of this spiraling motion, the bulk of the red, outflowing region in the bottom-left portion of the maps may be interpreted as a part of Group I, en route to the apocenter after having crossed the pericenter. The metallicity-based selection identifies most of the cold gas in these two groups as streams (middle panels of Fig. 9), except for a portion of Group II (region a), which does not get selected because of its somewhat higher metallicity (see the left panel of Fig. 7) and remains as a part of non-streams (middle panels of Fig. 10). This material, however, gets identified as streams in the streamline-based selection (right panels of Fig. 9), as the cold gas cells here have inflowing path lines with large positive d values (see the left panel of Fig. 8). But contrary to the metallicity-based selection, most of the outflowing cold gas in Group I (region b) does not get recognized as streams in the streamline-based selection, as their path lines are both currently and on-average outflowing over the tracing time, with negative d values (see the right panel of Fig. 8). Similarly, the cold gas in region c, which is currently inflowing, is not identified as streams in the streamline-based selection, as it is, on average, outflowing over the tracing time. While geometrically coincident with Group II, this material is likely to be kinematically associated with Group I as it falls back into the galaxy after its apocentric passage and is not a part of the streamline group that enters within Rd from the bottom-right (of the maps). As such, the cold gas here has likely been circulating in the galaxy for quite some time as opposed to being recently accreted, and therefore, perhaps rightfully, it should not be classified as streams.
The statement above notwithstanding, we note that both of our stream selection procedures are rather crude, and it is difficult to ascertain their comparative accuracy. Therefore, the somewhat different stream and non-stream classifications of cold gas resulting from the metallicity- and streamline-based selections are accepted at face value. In Sect. 5.4, we find that, on average, the mass in streams in the metallicity-based selection is more than that in the streamline-based selection. Therefore, the former can be regarded as a liberal stream selection procedure, while the latter is more conservative.
In Fig. 11, for VELA 7 at z = 1.5, the left, middle, and right panels, respectively, show the radial mass flux, Fr (in units of ℳ/tdyn), average radial velocity, Vr (in units of Vrot), and mass, M (in units of ℳ), as functions of r (in units of Rd) for all cold gas (black), streams (blue), and non-streams (red). The results from the metallicity-based selection are shown in the top row, while those from the streamline-based selection are plotted in the bottom row. Note that the cold gas Vr and Fr are re-plotted from the bottom left and right panels of Fig. 2, respectively, for convenient comparison with the stream and non-stream signals.
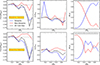 |
Fig. 11. Stream and non-stream radial profiles. The left, middle, and right panels respectively show the radial mass flux (Fr, in units of ℳ/tdyn), average radial velocity (Vr, in units of Vrot), and mass (M, in units of ℳ), as functions of radius r, normalized by Rd, for all cold gas (black), streams (blue), and non-streams (red) in VELA 7 at z = 1.5. The top row presents results from the metallicity-based classification, and the bottom row corresponds to the streamline-based classification. In both cases, the total radial mass flux of cold gas is dominated by streams at large radii (beyond ∼0.7 Rd) and by non-streams at small radii (within ∼0.3 Rd). In the metallicity-based selection, the dominance of stream flux at large r primarily reflects the higher mass fraction of streams in that region. In contrast, the streamline-based method shows roughly equal masses for streams and non-streams at large r; however, the non-stream mass flux remains low. This is because the inflowing and outflowing contributions from non-stream gas nearly cancel out (see Fig. 10), leaving streams as the main net contributor to the total radial mass flux. |
For the metallicity-based selection (top row), the mass in streams (non-streams) increases (decreases) with an increase in r, attaining values close to ℳ (zero) near r = Rd. Consequently, the cold gas radial mass flux, which is a sum of the stream and non-stream flux, is also dominated by the streams at large r, outside ∼0.7 Rd. Between ∼0.3 Rd to ∼0.7 Rd, the stream and non-stream fluxes are comparable in magnitude, with the non-stream flux oscillating between positive and negative values, while the stream flux is always negative. Inside ∼0.3 Rd, the stream flux tends to zero, and the cold gas flux, albeit very small, is dominated by the non-streams and directed outward. The stream Vr is mostly negative (except within ∼0.3 Rd), reaching values close to −0.2 Vrot near r = Rd. The non-stream Vr oscillates between positive and negative values. The cold gas Vr, which is a mass-weighted average of the stream and non-stream Vr, is almost the same as the stream Vr outside ∼0.7 Rd and as the non-stream Vr inside ∼0.3 Rd, owing to the mass dominance of the streams and non-streams in these two regions, respectively.
For the streamline-based selection (bottom row), the mass in streams (non-streams) increases (decreases) with r only up to about ∼0.4 Rd, after which it roughly stays the same up to ∼0.7 Rd, and then decreases (increases). The cold gas radial mass flux outside ∼0.7 Rd is dominated by the streams, as the non-stream flux is much smaller in magnitude. However, note that this is because of outflowing and inflowing non-stream fluxes of comparable magnitude almost canceling each other (see right panels of Fig. 10; contributions to the total non-stream flux from regions b and c almost cancel each other) and not because of small non-stream mass as in the metallicity-based selection. Similar to the metallicity-based selection, between ∼0.4 Rd to ∼0.7 Rd, the stream and non-stream fluxes are comparable in magnitude, with the non-stream flux being mostly positive and the stream flux being negative. Between ∼0.3 Rd to ∼0.4 Rd, however, the stream flux again dominates, but inside ∼0.3 Rd, the stream flux tends to zero, and the cold gas flux, albeit very small, is dominated by the non-streams as in the metallicity-based selection. The stream Vr is mostly negative, reaching values close to −0.4 Vrot near r = Rd, while the non-stream Vr is mostly positive and smaller in magnitude than the stream Vr. As the stream and non-stream masses are comparable outside ∼0.4 Rd, the cold gas Vr, being a mass-weighted average of the stream and non-stream Vr, is somewhere in between (and negative). Inside ∼0.4 Rd, the non-stream mass dominates, and the cold gas Vr is close to the non-stream Vr.
5.4. Stream and non-stream signal: Statistics
After having discussed a specific example, we now focus on the statistical findings from the VELA disk galaxy sample. In Fig. 12, the top, middle, and bottom rows, respectively, show Fr (in units of ℳ/tdyn), Vr (in units of Vrot), and M (in units of ℳ) as functions of r, in units of Rd, for streams (left panels), non-streams (middle panels), and all cold gas (right panels), with the solid lines indicating the medians over the disk galaxy sample and the envelopes representing the 16th − 84th percentiles. The results for the metallicity-based selection are shown in blue, while those for the streamline-based selection are plotted in green. Note that the Fr and Vr statistics for all cold gas (top and middle right panels, respectively) are the same as those shown in Fig. 3, re-plotted here for convenient comparison with the stream and non-stream statistics.
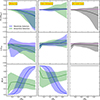 |
Fig. 12. Stream and non-stream statistics. The top, middle, and bottom rows display, respectively, the radial mass flux (Fr, in units of ℳ/tdyn), average radial velocity (Vr, in units of Vrot), and mass (M, in units of ℳ) as functions of radius, r, normalized by Rd, for streams (left panels), non-streams (middle panels), and all cold gas (right panels). Solid lines represent the median values across the disk galaxy sample, while shaded regions indicate the 16th–84th percentile ranges. The results from the metallicity-based selection are shown in blue, and those from the streamline-based selection are shown in green. In both classifications, the median cold gas mass flux at large radii is dominated by streams – beyond r ≳ 0.5Rd in the metallicity-based selection and beyond r ≳ 0.3Rd in the streamline-based selection. At smaller radii, the median stream flux approaches zero and falls below that of the non-stream component, resulting in a total cold gas flux that, while small, is primarily contributed by non-streams. The median radial velocity of streams remains predominantly negative across all radii, and its magnitude tends to exceed that of the non-streams, particularly at large r. Thus, on average, the radial transport of cold gas in the outer regions of the VELA disk galaxy sample is driven primarily by the infall of recently accreted streams. |
Most panels show a large scatter in the plotted quantities. Nonetheless, the median trends are illuminating. For the metallicity-based selection, the mass in streams (non-streams) increases (decreases) with increasing r, with the median mass attaining a value close to ℳ (zero) near r = Rd. In the streamline-based selection, the scatter is larger. However, the median stream (non-stream) mass increases (decreases) with increasing r, attains a maximum (minimum) of ∼0.4 (0.6) ℳ around ∼0.4 Rd, and then slightly decreases (increases) to ∼0.3 (0.7) ℳ near r = Rd. Note that in the metallicity-based selection, the mass in streams (non-streams) dominates at large (small) r, with the median stream mass being greater than 0.5ℳ for r ≳ 0.5 Rd. In the streamline-based selection, however, the mass in non-streams is greater than in streams (at least at the median level) at all r. Nevertheless, in both selections, the median non-stream flux is close to zero, and the median cold gas flux at large r (r ≳ 0.5 Rd in the metallicity-based selection and r ≳ 0.3 Rd in the streamline-based selection) is dominated by the streams. At smaller r, the median stream flux tends to zero and is smaller than the median non-stream flux, such that the median cold gas flux, although very small, is dominated by the non-streams. The median stream Vr is almost always negative, with typically larger magnitudes in the streamline-based selection than in the metallicity-based selection (the same is also true for the stream flux). The median non-stream Vr is typically close to zero and smaller in magnitude than the median stream Vr, especially at large r. The median cold gas Vr is always negative (also discussed in Sect. 3.2) but generally smaller in magnitude than the median stream Vr. This is expected as the cold gas Vr is a mass-weighted average of the stream and non-stream Vr. From the median trends in Fr and Vr, we conclude that, on average, the radial transport of cold gas in the VELA disk galaxy sample at large r is dominated by the inflowing motion of recently accreted streams. These trends are also robust against the details of the feedback physics employed in the simulations, which we have verified by comparing these results with a newer generation of the VELA simulations (Ceverino et al. 2023) that uses the same set of initial conditions but has stronger stellar feedback (see Appendix A).
In Fig. 12, we noted that the cold gas radial mass flux is dominated by the streams at large r in both selections. For the metallicity-based selection, this can be understood from the fact that at large r, the streams dominate the total cold gas mass (see bottom row of Fig. 12). However, in the streamline-based selection, there is more mass in non-streams than in streams at all r (at least at the median level). Despite this, the non-stream flux is close to zero. To investigate the reason behind this, in Fig. 13, we separately show the radial mass flux (in units of ℳ/tdyn) from the inflowing (top row) and outflowing (bottom row) regions of the streams (left panels), non-streams (middle panels), and all cold gas (right panels) as a function of r (in units of Rd), with the solid lines indicating the medians over the disk galaxy sample and the envelopes representing the 16th − 84th percentiles. The results for the metallicity-based selection are shown in blue, while those for the streamline-based selection are plotted in green.
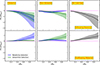 |
Fig. 13. Positive versus negative flux. The top and bottom rows illustrate the radial mass flux (Fr, in units of ℳ/tdyn) from inflowing and outflowing regions, respectively, for streams (left panels), non-streams (middle panels), and the total cold gas (right panels), plotted as a function of radius, r, normalized by Rd. Solid lines represent the median values across the disk galaxy sample, and shaded regions correspond to the 16th–84th percentile ranges. Results from the metallicity- and streamline-based classifications are shown in blue and green, respectively. In the streamline-based selection, inflowing and outflowing fluxes from non-stream gas are nearly equal in magnitude, comparable also to the inflowing stream flux, and largely cancel each other out. This leads to a total non-stream flux that is close to zero at the median level, though it exhibits significant scatter. A similar cancellation is also observed in the metallicity-based selection, where inflowing and outflowing non-stream fluxes are also comparable but individually much smaller than the stream flux, except at small radii (r ≲ 0.5 Rd), where the stream flux diminishes. As a result, the total non-stream flux in the metallicity-based selection also approaches zero, but with minimal scatter. |
From the middle panels, we note that the inflowing and outflowing non-stream fluxes in the streamline-based selection are not negligible (see also Sect. 5.3). In fact, they are similar in magnitude to the inflowing stream flux in the same selection. However, due to their comparable magnitude, they almost cancel each other, yielding a total non-stream flux that is close to zero at the median level, albeit with a large scatter (top-middle panel of Fig. 12). The outflowing stream flux in this selection is negligible, as the selection procedure does not generally identify outflowing regions in the galaxy (which are also likely to be outflowing for the past dynamical time) as streams (see Sect. 5.3). The inflowing and outflowing non-stream fluxes in the metallicity-based selection are also of comparable magnitude and can cancel each other. However, even by themselves, they are negligible compared to the stream flux in the same selection, except at small r (inside ∼0.5 Rd), where the stream flux is also small. This is because of the increasingly smaller mass in non-streams than in streams with increasing r. As such, the non-stream flux in this selection is also close to zero, with very little scatter (top-middle panel of Fig. 12). The outflowing stream flux in the metallicity-based selection is not negligible, as in this selection, outflowing regions may get identified as streams based on their metallicity. However, we note that the outflowing stream flux is typically smaller in magnitude than the inflowing stream flux such that the total stream flux (top-left panel of Fig. 12) is mostly negative. We also note that the non-stream inflowing and outflowing fluxes could just be non-circular motions that average out to zero. As we define inflows and outflows by the sign of the radial velocity, non-circular motions would be considered as flows in our analysis, and we can’t distinguish one from the other.
The marked difference in the stream mass in the two different selections, as seen in the bottom panel of Figure 12, warrants some discussion. It is possible that the streamline-based selection is more reliable in the inner disk, due to increasing metallicities toward the galaxy centers, which may make it difficult to distinguish between streams and non-streams in the metallicity-based selection (see also Section 5.3 and Figs. 9 and 10). But even the streamline-based selection shows declining stream mass inside ∼0.2 Rd, albeit not as stark as the decline in the metallicity-based selection. Over a few dynamical times, the streams are likely to phase-mix with the rest of the disk, and may become indistinguishable from the rest of the disk. However, more robust stream identification using tracer particles is required to understand the survival of streams within disks both temporally and spatially.
6. Comparison with observations
Using high-resolution Hα/CO imaging spectroscopy of nine rotating disks selected from the RC100 sample (Genzel et al. 2020; Nestor Shachar et al. 2023), Genzel et al. (2023) have found evidence of large non-circular motions. Assuming that all gas motions are in the plane of the disk, the non-circular motions are interpreted as radial. While distinguishing radial inflows from outflows can be difficult in observations because of projection effects, Genzel et al. (2023) argue that the inferred radial velocity signals from each of the nine disks are consistent with inflows (see Section 2.4.1 and Table 3 of Genzel et al. 2023). The RC100 sample consists of massive star-forming galaxies near the star formation main sequence with redshifts around the peak of cosmic star formation activity (0.6 < z < 2.5). The nine selected galaxies are moderately large (half mass radius > 4 kpc), well-resolved (FWHM resolution < 0.5″) with deep integrations (> 10 h), have low inclinations (< 70deg), and are devoid of both strong AGN activity and perturbations from nearby massive companions.
Using the forward modeling tool DYSMAL (Genzel et al. 2020; Price et al. 2021), which includes the effects of beam smearing and instrumental resolution, Genzel et al. (2023) constructed model velocity and velocity dispersion maps for purely rotating systems. After subtracting the model maps from the observed ones, second-order velocity residuals are obtained, which allow for the study of radial motions. Independently, a kinemetry analysis (Krajnović et al. 2006; Shapiro et al. 2008) of the observed velocity maps is also performed, providing model-independent evidence of large radial motions. The radial velocity signals obtained using the two different methods generally agree well with one another (see Sections 2 and 3 of Genzel et al. 2023).
Genzel et al. (2023, see Section 4.3.1) note that the observed radial velocities are in the same ballpark as the predictions from the different analytical models of radial transport based on disk instability (see Sect. 4 for a discussion on these models). However, given our current results from the VELA simulations that the radial transport of cold gas is dominated by the motion of recently accreted streams, the agreement between these model predictions and the observations may be a coincidence.
Therefore, instead of using the disk-instability-driven transport models, here, we interpret the Genzel et al. (2023) observations in light of the VELA simulations. In Figs. 14 and 15, ⟨Vr⟩/⟨Vrot⟩ is plotted against the cold gas fraction, f, and redshift, z, respectively, for all cold gas (left panel), streams (middle panels), and non-streams (right panels), with each circle corresponding to a particular snapshot in the VELA disk galaxy sample, color coded by z in Fig. 14 and by f in Fig. 15. Recall that ⟨Vr⟩ is the stream-, non-stream-, or disk-averaged radial velocity, as relevant, and ⟨Vrot⟩ is the disk-averaged rotational velocity. The red squares and the vertical error bars denote the medians and 16th − 84th percentiles, respectively, in f and z bins of varying widths, as indicated by the horizontal error bars, with the locations of the squares along the f- and z-axes being at the bin-averages. The results from the metallicity- and streamline-based selections are shown in the top and bottom rows, respectively. The green diamonds with vertical error bars highlight the Genzel et al. (2023) observations, where f corresponds to molecular gas fraction.
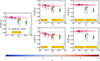 |
Fig. 14. Comparison of observations with the VELA disk galaxy sample. For all cold gas (left panel), streams (middle panels), and non-streams (right panels), ⟨Vr⟩/⟨Vrot⟩ is plotted as a function of the cold gas fraction (f). Each circle represents a snapshot from the VELA disk galaxy sample and is color coded by its corresponding redshift, z. Here, ⟨Vr⟩ denotes the stream-, non-stream-, or disk-averaged radial velocity, as relevant, and ⟨Vrot⟩ is the disk-averaged rotational velocity. Red squares indicate the median values within bins of f, with vertical error bars showing the 16th–84th percentile ranges and horizontal bars reflecting the bin widths. The horizontal position of each square corresponds to the average f within that bin. Results from the metallicity-based and streamline-based classifications are shown in the top and bottom rows, respectively. For comparison, observational data from Genzel et al. (2023) are represented by green diamonds with vertical error bars. These observations are consistent with the stream-averaged radial velocities obtained from the simulations (middle panels). In contrast, the disk-averaged (left panel) and non-stream-averaged (right panels) radial velocities are generally of much smaller magnitude and show limited agreement with the observed values. |
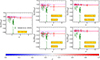 |
Fig. 15. Comparison of observations with the VELA disk galaxy sample. Same as in Figure 14 except now ⟨Vr⟩/⟨Vrot⟩ is plotted against the redshift, z, and the circles corresponding to the simulated disks are color coded by their gas fraction, f. The observations agree with the stream-averaged radial velocities found in the simulated disks (middle panels). The disk-averaged (left panel) and non-stream-averaged (right panels) radial velocities from the simulations typically have much smaller magnitudes and barely agree with the observations. |
In Fig. 16, the left and right panels show the histograms for f and z for the Genzel et al. (2023) galaxies in green and the VELA disk galaxy sample in red. The Genzel et al. (2023) galaxies are located at redshifts between 1 to 2.5 and have large gas fractions (f > 0.35). On the other hand, our disk galaxy sample spans a redshift range of ∼1 to ∼6 and has cold gas fractions varying from ∼0.01 to ∼0.7 (most of the sample has f < 0.35). Nevertheless, where they overlap in z and f, the Genzel et al. (2023) observations agree with the stream-averaged radial velocities from the simulations (middle panels of Figures 14 and 15). Note that the stream-averaged radial velocities are largely similar in both selections, capable of attaining large negative values (up to ∼0.6 − 0.8 times the disk-averaged rotational velocity). One exception is that the stream-averaged radial velocity in the streamline-based selection is always negative, whereas that in the metallicity-based selection can occasionally be positive (up to ∼0.2 times the disk-averaged rotational velocity). The disk-averaged (left panels) and non-stream-averaged (right panels) radial velocities from the simulations typically have much smaller magnitudes and barely agree with the observations.
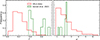 |
Fig. 16. Properties of observed disks. The left and right panels show the histograms for cold gas fraction, f, and redshift, z, for the VELA disks in red and the Genzel et al. (2023) galaxies in green. The VELA disks span a wider redshift range and have typically lower gas fractions than the Genzel et al. (2023) sample. While the lower gas fractions in VELA could potentially bias our conclusions, the simulated sample does include a few gas-rich galaxies. But the disk-averaged radial velocities in even these gas-rich galaxies barely reproduce the observations, which are much better explained when assumed to be originating from recently accreted streams. |
We note that the VELA galaxies tend to have lower gas fractions than the observed galaxies. Given the generally increasing trend in the disk-averaged radial inflow levels with increasing gas fraction, this could qualitatively explain why the simulated median disk-averaged radial velocities are typically much lower than the observed values. However, the simulated sample does include a few gas-rich galaxies, with f > 0.35 in 13% of the cases. The trend of disk-averaged radial velocity with gas fraction turns out to be rather weak, such that the disk-averaged radial velocities in these gas-rich galaxies barely reproduce the observed values, and it is much easier to explain the observations if assumed to be originating from freshly incoming streams.
We thus conclude that the inflow velocities within the streams in the simulated disks may explain the radial velocities deduced from the observations if the observed signal is dominated by recently accreted streams and is characteristic of their (mass-weighted) average radial motions. A more robust comparison is yet to be performed, where observationally realistic Hα mocks of the simulated VELA disks are analyzed the same way as the observed galaxies using DYSMAL. Apart from accretion along cold streams, gas transport along a bar may be another way to achieve large radial motions (Pastras et al. 2025). However, only one of the nine galaxies in the Genzel et al. (2023) sample shows strong evidence for the presence of a bar, and it is unclear whether bar-driven transport is also important for the rest of the sample.
7. Conclusion
We studied the radial transport of cold gas in simulated star-forming disk galaxies at cosmic noon, z ∼ 4 − 1, utilizing the VELA hydro-cosmological simulations and zooming in with 17.5−35 pc maximum resolution on 34 galaxies with halos of mass 1011 − 1012 M⊙ at z ∼ 2. From all the VELA snapshots, rotation-supported disks were selected by requiring that the disk radius be at least three times the disk height and the average rotational velocity be greater than the radial velocity dispersion at all r, i.e., the cylindrical distance from the galactic center. With these selection criteria, the disk fraction among all VELA snapshots is ∼39%. Our main findings are summarized as follows.
-
The radial transport is dominated by inflows.
-
The average radial velocity and radial mass flux as functions of r are mostly negative, and on average, they increase in magnitude with increasing r, except within ∼0.2 Rd, where the trend is reversed.
-
The disk-averaged radial velocities are negative in 82% of the galaxies and positive in the rest.
-
The disk-averaged inflow is correlated with cold gas fraction and redshift. Both correlations are rather weak, but the one will cold gas fraction is more pronounced.
-
-
For most of the VELA disks, the different analytical models of radial transport based on disk instability predict higher levels of disk-averaged inflow than that found in the simulations. An exception is the Dekel et al. (2020) model, which for Q = 1 agrees reasonably well with the simulations. However, this model is not directly applicable to general disks, as it specifically refers to the migration of a thin ring.
-
Using two different crude stream selection techniques, one based on metallicities and another on streamlines, we classified the cold gas within the disk into recently accreted streams versus off-stream material. On average, the streams are found to dominate the radial mass flux outside the inner disk (r ≳ 0.3Rd for the streamline-based selection and r ≳ 0.5Rd for the metallicity-based selection).
-
The average radial velocities within the inflowing streams in the simulations are at the level of the inflow velocities indicated in the observed disks at cosmic noon by Genzel et al. (2023). The simulated off-stream gas shows much lower average radial velocities.
We conclude that the inward radial transport of cold gas in extended star-forming disk galaxies at cosmic noon is dominated by the external radial velocities of the incoming streams that penetrate the halo from the cosmic web and accrete onto the disk rather than being driven by torques from internal disk instabilities. Future studies with smoothed-particle hydrodynamics simulations or AMR simulations with tracer particles, where recently accreted gas along cold streams can be identified with better accuracy, should further solidify our novel result. We note that while the current ART code does not have the capability to add tracers, AMR simulations with tracers can be performed using other codes, such as RAMSES (Teyssier 2002).
Our finding that the disk-averaged inward radial transport in the cosmological simulations is significantly weaker than the predictions of the analytical models for isolated disks poses an open question for future study. One option is that the dominant presence of anisotropic incoming streams from the cosmic web changes the overall conditions in the disks in a way that invalidates some of the assumptions made in the analytical models. In particular, it may affect the energy balance in the turbulent disk between streams, feedback, dissipation, and radial transport. Also, the premise that Q is self-regulated to a value less than or equal to unity may not be valid for the simulated disks. Indeed, by analyzing a few of the VELA disks, Inoue et al. (2016) found that while collapsed clumps tend to have Q < 1, proto-clump regions generally have Q ≳ 2 − 3. The high Q-values possibly represent excessive compressive modes of turbulence, likely induced by external perturbations, such as intense accretion along the incoming streams (see also Mandelker et al. 2025; Ginzburg et al. 2025). However, there are also indications from simulations of isolated disks for low averaged radial inflows, with significant deviations from axial symmetry, qualitatively similar to the findings from our cosmological simulations (private communications with Andreas Burkert and Oscar Agertz). This may indicate weaknesses in the analytical models based on disk instability more profound than missing the incoming streams. It is also possible that a contribution to the gas turbulence-driving in such isolated disks by stellar feedback reduces the radial inflow rates compared to what is predicted by the various disk-instability-based models ignoring feedback (Krumholz et al. 2018). However, previous work by Goldbaum et al. (2016) using isolated disk simulations with gas fractions up to 20% show that including feedback only modestly lowers the levels of radial inflow compared to that in simulations without feedback (Goldbaum et al. 2015).
Acknowledgments
We are grateful to the referee, Dylan Nelson, for many insightful comments, which led to significant improvements in the manuscript. We also thank Andreas Burkert, Joel Primack, and Oscar Agertz for stimulating discussions. This research has been supported by the Israel Science Foundation (ISF) grant 861/20, grants 2023723 and 2023730 from the US-Israel Binational Science Foundation and the US National Science Foundation (BSF-NSF), and the NSF grant PHY-2309135 to the Kavli Institute for Theoretical Physics (KITP). DDC acknowledges support from the Excellence Fellowship Program for International Postdoctoral Researchers by the Council for Higher Education and the Israel Academy of Sciences and Humanities. NM is supported by the ISF grant 3061/21 and the BSF-NSF grant 2020302.
References
- Agertz, O., Teyssier, R., & Moore, B. 2009, MNRAS, 397, L64 [NASA ADS] [CrossRef] [Google Scholar]
- Aung, H., Mandelker, N., Nagai, D., Dekel, A., & Birnboim, Y. 2019, MNRAS, 490, 181 [NASA ADS] [CrossRef] [Google Scholar]
- Aung, H., Mandelker, N., Dekel, A., et al. 2024, MNRAS, 532, 2965 [NASA ADS] [CrossRef] [Google Scholar]
- Birnboim, Y., & Dekel, A. 2003, MNRAS, 345, 349 [Google Scholar]
- Bouché, N., Dekel, A., Genzel, R., et al. 2010, ApJ, 718, 1001 [Google Scholar]
- Bournaud, F., Perret, V., Renaud, F., et al. 2014, ApJ, 780, 57 [Google Scholar]
- Bryan, G. L., & Norman, M. L. 1998, ApJ, 495, 80 [NASA ADS] [CrossRef] [Google Scholar]
- Cacciato, M., Lahav, O., van den Bosch, F. C., Hoekstra, H., & Dekel, A. 2012, MNRAS, 426, 566 [Google Scholar]
- Ceverino, D., & Klypin, A. 2009, ApJ, 695, 292 [Google Scholar]
- Ceverino, D., Dekel, A., & Bournaud, F. 2010, MNRAS, 404, 2151 [NASA ADS] [Google Scholar]
- Ceverino, D., Dekel, A., Mandelker, N., et al. 2012, MNRAS, 420, 3490 [NASA ADS] [CrossRef] [Google Scholar]
- Ceverino, D., Klypin, A., Klimek, E. S., et al. 2014, MNRAS, 442, 1545 [NASA ADS] [CrossRef] [Google Scholar]
- Ceverino, D., Arribas, S., Colina, L., et al. 2016a, MNRAS, 460, 2731 [Google Scholar]
- Ceverino, D., Sánchez Almeida, J., Muñoz Tuñón, C., et al. 2016b, MNRAS, 457, 2605 [NASA ADS] [CrossRef] [Google Scholar]
- Ceverino, D., Mandelker, N., Snyder, G. F., et al. 2023, MNRAS, 522, 3912 [NASA ADS] [CrossRef] [Google Scholar]
- Danovich, M., Dekel, A., Hahn, O., & Teyssier, R. 2012, MNRAS, 422, 1732 [Google Scholar]
- Danovich, M., Dekel, A., Hahn, O., Ceverino, D., & Primack, J. 2015, MNRAS, 449, 2087 [Google Scholar]
- Dekel, A., & Birnboim, Y. 2006, MNRAS, 368, 2 [NASA ADS] [CrossRef] [Google Scholar]
- Dekel, A., & Mandelker, N. 2014, MNRAS, 444, 2071 [NASA ADS] [CrossRef] [Google Scholar]
- Dekel, A., Sari, R., & Ceverino, D. 2009a, ApJ, 703, 785 [Google Scholar]
- Dekel, A., Birnboim, Y., Engel, G., et al. 2009b, Nature, 457, 451 [Google Scholar]
- Dekel, A., Zolotov, A., Tweed, D., et al. 2013, MNRAS, 435, 999 [Google Scholar]
- Dekel, A., Lapiner, S., Ginzburg, O., et al. 2020, MNRAS, 496, 5372 [NASA ADS] [CrossRef] [Google Scholar]
- Elmegreen, B. G., & Burkert, A. 2010, ApJ, 712, 294 [Google Scholar]
- Elmegreen, B. G., & Elmegreen, D. M. 2005, ApJ, 627, 632 [Google Scholar]
- Elmegreen, D. M., Elmegreen, B. G., Ravindranath, S., & Coe, D. A. 2007, ApJ, 658, 763 [Google Scholar]
- Erb, D. K., Steidel, C. C., Shapley, A. E., Pettini, M., & Adelberger, K. L. 2004, ApJ, 612, 122 [NASA ADS] [CrossRef] [Google Scholar]
- Forbes, J., Krumholz, M., & Burkert, A. 2012, ApJ, 754, 48 [NASA ADS] [CrossRef] [Google Scholar]
- Forbes, J. C., Krumholz, M. R., Burkert, A., & Dekel, A. 2014, MNRAS, 438, 1552 [NASA ADS] [CrossRef] [Google Scholar]
- Forbes, J. C., Emami, R., Somerville, R. S., et al. 2023, ApJ, 948, 107 [NASA ADS] [CrossRef] [Google Scholar]
- Förster Schreiber, N. M., Genzel, R., Lehnert, M. D., et al. 2006, ApJ, 645, 1062 [Google Scholar]
- Förster Schreiber, N. M., Genzel, R., Bouché, N., et al. 2009, ApJ, 706, 1364 [Google Scholar]
- Genel, S., Dekel, A., & Cacciato, M. 2012a, MNRAS, 425, 788 [CrossRef] [Google Scholar]
- Genel, S., Naab, T., Genzel, R., et al. 2012b, ApJ, 745, 11 [NASA ADS] [CrossRef] [Google Scholar]
- Genzel, R., Tacconi, L. J., Eisenhauer, F., et al. 2006, Nature, 442, 786 [Google Scholar]
- Genzel, R., Burkert, A., Bouché, N., et al. 2008, ApJ, 687, 59 [Google Scholar]
- Genzel, R., Newman, S., Jones, T., et al. 2011, ApJ, 733, 101 [Google Scholar]
- Genzel, R., Förster Schreiber, N. M., Lang, P., et al. 2014, ApJ, 785, 75 [NASA ADS] [CrossRef] [Google Scholar]
- Genzel, R., Price, S. H., Übler, H., et al. 2020, ApJ, 902, 98 [NASA ADS] [CrossRef] [Google Scholar]
- Genzel, R., Jolly, J. B., Liu, D., et al. 2023, ApJ, 957, 48 [NASA ADS] [CrossRef] [Google Scholar]
- Ginzburg, O., Huertas-Company, M., Dekel, A., et al. 2021, MNRAS, 501, 730 [Google Scholar]
- Ginzburg, O., Dekel, A., Mandelker, N., & Krumholz, M. R. 2022, MNRAS, 513, 6177 [NASA ADS] [CrossRef] [Google Scholar]
- Ginzburg, O., Dekel, A., Mandelker, N., et al. 2025, A&A, 698, A110 [NASA ADS] [CrossRef] [EDP Sciences] [Google Scholar]
- Goldbaum, N. J., Krumholz, M. R., & Forbes, J. C. 2015, ApJ, 814, 131 [NASA ADS] [CrossRef] [Google Scholar]
- Goldbaum, N. J., Krumholz, M. R., & Forbes, J. C. 2016, ApJ, 827, 28 [NASA ADS] [CrossRef] [Google Scholar]
- Goldreich, P., & Lynden-Bell, D. 1965, MNRAS, 130, 97 [NASA ADS] [CrossRef] [Google Scholar]
- Grand, R. J. J., Gómez, F. A., Marinacci, F., et al. 2017, MNRAS, 467, 179 [NASA ADS] [Google Scholar]
- Hopkins, P. F., Kereš, D., Oñorbe, J., et al. 2014, MNRAS, 445, 581 [NASA ADS] [CrossRef] [Google Scholar]
- Huertas-Company, M., Guo, Y., Ginzburg, O., et al. 2020, MNRAS, 499, 814 [NASA ADS] [CrossRef] [Google Scholar]
- Inoue, S., Dekel, A., Mandelker, N., et al. 2016, MNRAS, 456, 2052 [CrossRef] [Google Scholar]
- Kassin, S. A., Weiner, B. J., Faber, S. M., et al. 2007, ApJ, 660, L35 [Google Scholar]
- Kassin, S. A., Weiner, B. J., Faber, S. M., et al. 2012, ApJ, 758, 106 [NASA ADS] [CrossRef] [Google Scholar]
- Kereš, D., Katz, N., Weinberg, D. H., & Davé, R. 2005, MNRAS, 363, 2 [Google Scholar]
- Klessen, R. S., & Hennebelle, P. 2010, A&A, 520, A17 [NASA ADS] [CrossRef] [Google Scholar]
- Krajnović, D., Cappellari, M., de Zeeuw, P. T., & Copin, Y. 2006, MNRAS, 366, 787 [Google Scholar]
- Kravtsov, A. V. 2003, ApJ, 590, L1 [NASA ADS] [CrossRef] [Google Scholar]
- Kravtsov, A. V., Klypin, A. A., & Khokhlov, A. M. 1997, ApJS, 111, 73 [Google Scholar]
- Krumholz, M., & Burkert, A. 2010, ApJ, 724, 895 [NASA ADS] [CrossRef] [Google Scholar]
- Krumholz, M. R., Burkhart, B., Forbes, J. C., & Crocker, R. M. 2018, MNRAS, 477, 2716 [CrossRef] [Google Scholar]
- Lapiner, S., Dekel, A., Freundlich, J., et al. 2023, MNRAS, 522, 4515 [NASA ADS] [CrossRef] [Google Scholar]
- Madau, P., & Dickinson, M. 2014, ARA&A, 52, 415 [Google Scholar]
- Mandelker, N., Dekel, A., Ceverino, D., et al. 2014, MNRAS, 443, 3675 [NASA ADS] [CrossRef] [Google Scholar]
- Mandelker, N., Dekel, A., Ceverino, D., et al. 2017, MNRAS, 464, 635 [NASA ADS] [CrossRef] [Google Scholar]
- Mandelker, N., van Dokkum, P. G., Brodie, J. P., van den Bosch, F. C., & Ceverino, D. 2018, ApJ, 861, 148 [NASA ADS] [CrossRef] [Google Scholar]
- Mandelker, N., Nagai, D., Aung, H., et al. 2019, MNRAS, 484, 1100 [Google Scholar]
- Mandelker, N., Nagai, D., Aung, H., et al. 2020, MNRAS, 494, 2641 [Google Scholar]
- Mandelker, N., Ginzburg, O., Dekel, A., et al. 2025, MNRAS, 538, L9 [Google Scholar]
- Martin, D. C., O’Sullivan, D., Matuszewski, M., et al. 2019, Nat. Astron., 3, 822 [NASA ADS] [CrossRef] [Google Scholar]
- Nelson, D., Vogelsberger, M., Genel, S., et al. 2013, MNRAS, 429, 3353 [NASA ADS] [CrossRef] [Google Scholar]
- Nelson, D., Genel, S., Vogelsberger, M., et al. 2015, MNRAS, 448, 59 [Google Scholar]
- Nestor Shachar, A., Price, S. H., Förster Schreiber, N. M., et al. 2023, ApJ, 944, 78 [NASA ADS] [CrossRef] [Google Scholar]
- Noguchi, M. 1999, ApJ, 514, 77 [NASA ADS] [CrossRef] [Google Scholar]
- Obreschkow, D., Glazebrook, K., Bassett, R., et al. 2015, ApJ, 815, 97 [Google Scholar]
- Ocvirk, P., Pichon, C., & Teyssier, R. 2008, MNRAS, 390, 1326 [Google Scholar]
- Okalidis, P., Grand, R. J. J., Yates, R. M., & Kauffmann, G. 2021, MNRAS, 504, 4400 [Google Scholar]
- Oklopčić, A., Hopkins, P. F., Feldmann, R., et al. 2017, MNRAS, 465, 952 [CrossRef] [Google Scholar]
- Padnos, D., Mandelker, N., Birnboim, Y., et al. 2018, MNRAS, 477, 3293 [NASA ADS] [CrossRef] [Google Scholar]
- Pastras, S., Genzel, R., Tacconi, L. J., et al. 2025, A&A, in press, https://doi.org/10.1051/0004-6361/202555430 [Google Scholar]
- Pichon, C., Pogosyan, D., Kimm, T., et al. 2011, MNRAS, 418, 2493 [CrossRef] [Google Scholar]
- Price, S. H., Shimizu, T. T., Genzel, R., et al. 2021, ApJ, 922, 143 [NASA ADS] [CrossRef] [Google Scholar]
- Romeo, A. B., & Falstad, N. 2013, MNRAS, 433, 1389 [NASA ADS] [CrossRef] [Google Scholar]
- Schmidt, T. M., Bigiel, F., Klessen, R. S., & de Blok, W. J. G. 2016, MNRAS, 457, 2642 [NASA ADS] [CrossRef] [Google Scholar]
- Sellwood, J. A., & Sánchez, R. Z. 2010, MNRAS, 404, 1733 [NASA ADS] [Google Scholar]
- Shapiro, K. L., Genzel, R., Förster Schreiber, N. M., et al. 2008, ApJ, 682, 231 [NASA ADS] [CrossRef] [Google Scholar]
- Shibuya, T., Ouchi, M., Kubo, M., & Harikane, Y. 2016, ApJ, 821, 72 [NASA ADS] [CrossRef] [Google Scholar]
- Simons, R. C., Kassin, S. A., Weiner, B. J., et al. 2017, ApJ, 843, 46 [Google Scholar]
- Speights, J. C., Godwin, C., Reimer, R., Benton, A., & Lemaire, R. 2019, ApJ, 883, 77 [Google Scholar]
- Stark, D. P., Swinbank, A. M., Ellis, R. S., et al. 2008, Nature, 455, 775 [NASA ADS] [CrossRef] [Google Scholar]
- Stott, J. P., Swinbank, A. M., Johnson, H. L., et al. 2016, MNRAS, 457, 1888 [Google Scholar]
- Strawn, C., Roca-Fàbrega, S., Mandelker, N., et al. 2021, MNRAS, 501, 4948 [Google Scholar]
- Swinbank, A. M., Sobral, D., Smail, I., et al. 2012, MNRAS, 426, 935 [NASA ADS] [CrossRef] [Google Scholar]
- Swinbank, A. M., Harrison, C. M., Trayford, J., et al. 2017, MNRAS, 467, 3140 [NASA ADS] [Google Scholar]
- Tacchella, S., Dekel, A., Carollo, C. M., et al. 2016a, MNRAS, 458, 242 [NASA ADS] [CrossRef] [Google Scholar]
- Tacchella, S., Dekel, A., Carollo, C. M., et al. 2016b, MNRAS, 457, 2790 [Google Scholar]
- Teyssier, R. 2002, A&A, 385, 337 [CrossRef] [EDP Sciences] [Google Scholar]
- Tomassetti, M., Dekel, A., Mandelker, N., et al. 2016, MNRAS, 458, 4477 [NASA ADS] [CrossRef] [Google Scholar]
- Toomre, A. 1964, ApJ, 139, 1217 [Google Scholar]
- Trapp, C. W., Kereš, D., Chan, T. K., et al. 2022, MNRAS, 509, 4149 [Google Scholar]
- Übler, H., Genzel, R., Wisnioski, E., et al. 2019, ApJ, 880, 48 [Google Scholar]
- van de Voort, F., Schaye, J., Booth, C. M., Haas, M. R., & Dalla Vecchia, C. 2011, MNRAS, 414, 2458 [NASA ADS] [CrossRef] [Google Scholar]
- Veilleux, S., Maiolino, R., Bolatto, A. D., & Aalto, S. 2020, A&ARv, 28, 2 [NASA ADS] [CrossRef] [Google Scholar]
- Wada, K., Meurer, G., & Norman, C. A. 2002, ApJ, 577, 197 [NASA ADS] [CrossRef] [Google Scholar]
- Wisnioski, E., Förster Schreiber, N. M., Wuyts, S., et al. 2015, ApJ, 799, 209 [Google Scholar]
- Wisnioski, E., Förster Schreiber, N. M., Fossati, M., et al. 2019, ApJ, 886, 124 [Google Scholar]
- Wong, T., Blitz, L., & Bosma, A. 2004, ApJ, 605, 183 [NASA ADS] [CrossRef] [Google Scholar]
- Zolotov, A., Dekel, A., Mandelker, N., et al. 2015, MNRAS, 450, 2327 [Google Scholar]
Appendix A: Impact of different feedback models
The results discussed in the main text are derived from analyzing the VELA simulations introduced in Ceverino et al. (2014) and Zolotov et al. (2015), hereafter referred to as VELA-g3. A newer generation of the VELA simulations was presented in Ceverino et al. (2023), which, referred to as VELA-g6, uses the same set of initial conditions as in VELA-g3 but differs in its modeling of stellar feedback. In addition to thermal feedback from supernovae and feedback from radiation pressure (same as that in VELA-g3), VELA-g6 includes moderate IR trapping and kinetic feedback from expanding supernovae shells and stellar winds, resulting in stronger stellar feedback.
Here, we ascertain the impact of the different feedback models used in VELA-g3 and VELA-g6, if any, on the properties of the radial transport of cold gas in the simulated disks. Rotation-supported disks are identified from the VELA-g6 snapshots using the same procedure as that adopted for VELA-g3 (see Section 2.3). The cold gas in these disks is then classified into streams and non-streams following the same metallicity and streamline-based selection techniques and thresholds used for VELA-g3, as discussed in Sections 5.2.1 and 5.2.2, respectively.
In Fig. A.1, the left, middle, and right panels show the radial mass flux, Fr (in units of of ℳ/tdyn), for streams, non-streams, and all cold gas, respectively, for the VELA-g3 (top row) and VELA-g6 (bottom row) disk galaxy samples, with the solid lines indicating the medians and the envelopes representing the 16th − 84th percentile variations. The results from the metallicity- and streamline-based selections are shown in blue and green, respectively.
Upon comparing the results from the two generations, the median cold gas Fr in VELA-g6 disks is found to be slightly larger in magnitude than that in VELA-g3 disks, especially in the outer parts (r > 0.5 Rd). This is likely because, on average, gas fractions in VELA-g6 are somewhat higher than that in VELA-g3 (a weak correlation between the strength of radial transport and cold gas fraction in disks is established in Section 3.2), an effect of stronger stellar feedback (see Ceverino et al. 2023). For reference, the histograms for the cold gas fractions, f, in VELA-g3 and VELA-g6 disks are shown in Fig. A.2 in red and orange, respectively. While the median and 16th − 84th percentile variation in f for VELA-g3 disks is  , that for VELA-g6 disks is
  . However, despite the differences discussed above, Fig. A.1 shows that the radial transport of cold gas in both VELA-g3 and VELA-g6 disks, especially in the outer parts, is dominated by stream inflows or the motion of recently accreted gas.
Thus, our key result, namely, the dominance of stream inflows in the radial transport of cold gas in simulated, cosmic noon disks, holds irrespective of the strength of stellar feedback or the details of the feedback physics.
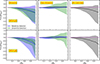 |
Fig. A.1. Cold gas radial transport in VELA-g3 versus VELA-g6. The top and bottom rows depict the radial mass flux, Fr (in units of ℳ/tdyn), in VELA-g3 and VELA-g6 disks, respectively, with the left, middle, and right panels, respectively, focusing on streams, non-streams, and all cold gas. The solid lines indicate the medians and the envelopes represent the 16th − 84th percentile variations. Rotation-supported disks are identified from all snapshots using the procedure outlined in Section 2.3, and the results from the metallicity- and streamline-based stream selections, as described in Sections 5.2.1 and 5.2.2, are shown in blue and green, respectively. The median cold gas Fr is slightly larger in magnitude in VELA-g6 disks, especially in the outer parts (r > 0.5Rd), likely due to somewhat larger gas fractions in VELA-g6 compared to VELA-g3 (this is because of stronger stellar feedback in VELA-g6, see Fig. A.2). However, Fr is dominated by stream inflows in both VELA-g3 and VELA-g6 disks, especially in the outer parts, irrespective of the strength of stellar feedback or the details of feedback physics. |
Appendix B: Impact of different stream selections
As the VELA simulations are Eulerian in nature, identifying incoming streams of cold gas is a non-trivial task. In Sections 5.2.1 and 5.2.2, we, respectively, describe the crude procedures adopted in this paper based on gas metallicities and streamlines for selecting cold gas cells that may belong to recently accreted streams. Here, we investigate whether variations in the default thresholds adopted in these methods to distinguish between streams and non-streams significantly affect our main result.
In the metallicity-based selection, the metallicity at the pth percentile (Zcut) of the mass-weighted metallicity distribution between r = Rd to 2Rd and z = −Hd to Hd is used to distinguish between streams and non-streams (see Section 5.2.1). Here, we study the dependence of stream selection on Zcut by adopting different values of p, namely, 90, 95, and 99, with p = 99 being the default used in the main text. Similarly, in the streamline-based selection, gas cells that move inward by distances greater than dcut over the average disk dynamical time are classified as streams and the rest as non-streams (see Section 5.2.2). We also study the sensitivity of stream selection on dcut by allowing it to vary within a factor of 2 (0.05 or 0.2Rd) of the default value of 0.1Rd used in the main text.
In Figure B.1, the left, middle, and right panels show the radial mass flux, Fr (in units of ℳ/tdyn), for streams, non-streams, and all cold gas, respectively, for the metallicity- (top row) and streamline-based (bottom row) selections with different thresholds, as labeled, and applied to VELA-g3 disks. The solid lines indicate the medians, and the envelopes represent the 16th − 84th percentile variations. As expected, the median stream signal is slightly larger in magnitude for larger values of Zcut and smaller values of dcut, which tend to select more mass in streams. However, irrespective of the values adopted for Zcut and dcut, the cold gas radial mass flux is dominated by the stream flux, especially in the outer disks.
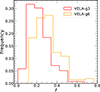 |
Fig. B.1. Cold gas radial transport in VELA-g3 with different stream selection thresholds. The top and bottom rows show the radial mass flux, Fr (in units of ℳ/tdyn) in the metallicity- and streamline-based selections, respectively, applied to VELA-g3 disks, with the left, middle, and right panels, respectively, focusing on streams, non-streams, and all cold gas. The solid lines indicate the medians and the envelopes represent the 16th − 84th percentile variations. Results are shown for Zcut = pth percentile, where p = 99 (blue), 95 (yellow), and 90 (red), and dcut = 0.05 (cyan), 0.1 (green), and 0.2Rd (brown). Here, Zcut is the threshold metallicity from the mass-weighted metallicity distribution between r = Rd to 2Rd and z = −Hd to Hd used to distinguish between streams and non-streams in the metallicity-based selection (see Section 5.2.1). Similarly, dcut is the minimum distance by which gas cells must travel inward over the average disk dynamical time to be classified as streams in the streamline-based selection (see Section 5.2.2). While the median stream signal is slightly larger in magnitude for larger values of Zcut and smaller values of dcut, the dominance of incoming streams in the cold gas radial mass flux is insensitive to the exact values adopted for the thresholds in the different stream selection procedures. |
Thus, our main result pertaining to the dominance of stream inflows in the radial transport of cold gas in simulated, cosmic noon disks holds independently of the exact values adopted for the thresholds in the different stream selection procedures.
Appendix C: Comparison with transport models at different radii
In the main text, we demonstrate that the predictions from the disk-instability-based radial transport models are a poor match to the disk-averaged radial inflow velocities seen in most of the VELA disks. Here, we investigate whether the same also holds when comparing the average inflow velocities at different radii.
The first two panels of Figure C.1 plot Vr/Vrot against Vrot/σr for each of the VELA disks with the blue, round points, the left and middle panels corresponding to r = 0.5 Rd and r = Rd, respectively. The corresponding disk-averaged quantities are plotted against each other in the right panel. In each panel, the red squares and the vertical error bars denote the medians and the 16th − 84th percentiles, respectively, in x bins of varying widths (where x = Vrot/σr or ⟨Vrot⟩/⟨σr⟩, as applicable), with the locations of the squares along the x-axes being at the bin-averages. The predictions for the radial inflow velocities from the various disk-instability-based transport models are overlaid with the different curves, as labeled, assuming Q = 1. Most of the VELA disks show low average inflow velocities, not-only in a disk-averaged sense, but also both at r = 0.5 Rd and r = Rd, compared to that predicted by the different transport models. We have verified this is true for other radial bins as well. Assuming Q = 0.68 in the models would result in an even poorer match, as the model inflows increase as Q decreases (see Section 4).
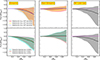 |
Fig. C.1. Comparison with disk-instability-based transport models at different radii. For each of the VELA disks, the left and middle panels plot Vr/Vrot against Vrot/σr at r = 0.5 Rd and r = Rd, respectively, with the blue, round points. The corresponding disk-averaged quantities are shown in the right panel. Red squares indicate the median values within bins of x (where x = Vrot/σr or ⟨Vrot⟩/⟨σr⟩, as applicable), with the vertical error bars highlighting the 16th − 84th percentile ranges and the horizontal error bars showing the bin widths. The disk-instability-based model predictions (see Section 4) are shown with the different curves, as labeled, assuming Q = 1. For most of the VELA disks, these models predict higher levels of inflow than that seen in the simulations, not only in a disk-averaged sense but also locally at different r. |
Appendix D: Correlation of radial transport with cold gas mass
Here, we examine the correlation, if any, of the radial transport of cold gas through the disk with the total cold gas mass.
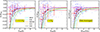 |
Fig. D.1. Cold gas fractions in VELA-g3 versus VELA-g6. Histograms for the cold gas fractions in VELA-g3 and VELA-g6 disks are shown in red and orange, respectively. On average, gas fractions in VELA-g6 disks tend to be somewhat higher, with a median value of 0.3 as opposed to 0.2 in VELA-g3 disks. |
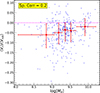 |
Fig. D.2. Trend in disk-averaged inflow with cold gas mass. The ratio of the disk-averaged radial to rotational velocity, ⟨Vr⟩/⟨Vrot⟩, is plotted against the total cold gas mass in the disk, Md (in logarithmic units), with the blue, round points for the VELA disk galaxy sample. Red squares indicate the median values within bins of log[Md], with the vertical error bars highlighting the 16th − 84th percentile ranges and the horizontal error bars showing the bin widths. On average, with increase in Md, the magnitude of ⟨Vr⟩/⟨Vrot⟩ slightly decreases. The correlation, however, is quite weak, with a Spearman rank correlation coefficient of 0.2. |
In Figure D.1, ⟨Vr⟩/⟨Vrot⟩ is plotted against Md (in logarithmic units), the total cold gas mass in the disk, for each of the VELA disks with the blue, round points. The red squares and the vertical error bars denote the medians and the 16th − 84th percentiles, respectively, in bins of log[Md], with the locations of the squares along the log[Md] axis being at the bin-averages. We find a very weak trend with log[Md], bearing a Spearman rank correlation coefficient of 0.2. On average, as Md increases, the magnitude of ⟨Vr⟩/⟨Vrot⟩ slightly decreases.
Appendix E: Radial transport of warm/hot gas
Here, we investigate if there is any significant, additional contribution to the radial transport through VELA disks from gas above 1.5 × 10⁴K.
In Figure E.1, we show the histogram for the ratio of the cold gas (defined as gas below 1.5 × 10⁴K) mass, Md, to the total gas mass in the disk, Mg, for the VELA disk galaxy sample. At least 80% and typically around 85-90% of the gas mass in the disks is in the cold phase. Hence, we do not expect any additional major contribution to the radial transport through the disk from gas above 1.5 × 10⁴K.
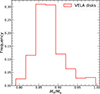 |
Fig. E.1. Mass fraction of cold gas to total disk gas. Histogram for the ratio of the mass in the cold phase (T < 1.5 × 10⁴K), Md, to the total gas mass in the disk, Mg. Atleast 80% and typically, around 85 to 90% of the disk gas mass is in the cold phase. |
In Figure E.2, we demonstrate this explicitly for VELA-7 at z = 1.5. The left panel shows the mass-weighted histogram for disk gas temperatures. The cumulative mass in the cold phase is around 88 % of the total gas mass in the disk. The right panel shows the ratio of the average radial-to-rotational velocity in cylindrical shells, Vr/Vrot, as a function of r (in units of Rd), adopting three different gas temperature cuts, as labeled. We find no significant additional contribution to the radial transport through the disk from gas above 1.5 × 10⁴K.
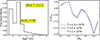 |
Fig. E.2. Radial transport through the disk for different gas temperature thresholds. The left panel shows the mass-weighted histogram for the disk gas temperatures for VELA 7 at z = 1.5. The brown, dashed line indicates T = 1.5 × 10⁴K, the threshold used to define the cold phase, and the cumulative mass in the cold phase is around 88% of the total gas mass in the disk. In the right panel, we plot Vr/Vrot as a function of r (in units of Rd) for three different gas temperature cuts, as labeled. There is no significant additional contribution to average radial velocities through the disk from gas above T = 1.5 × 10⁴K. |
All Figures
|
Fig. 1. Disk selection. The ratio of the disk-averaged rotational velocity to the disk-averaged radial velocity dispersion, ⟨Vrot⟩/⟨σr⟩, is plotted against the ratio of the disk radius to the disk height, Rd/Hd, for all 1098 snapshots belonging to 34 VELA galaxies with the round blue points. Of these, 425 snapshots satisfy the conditions Rd/Hd > 3 and Vrot/σr > 1 at all r, the distance from the galactic center in cylindrical coordinates, and they are selected as rotation-supported disks (highlighted by the red stars). Here, Vrot and σr are the average rotational velocity and the radial velocity dispersion of cold gas as a function of r, respectively. The gray dashed vertical and horizontal lines indicate Rd/Hd = 3 and ⟨Vrot⟩/⟨σr⟩ = 1, respectively. Some of the blue points with Rd/Hd > 3 and ⟨Vrot⟩/⟨σr⟩> 1 do not satisfy the condition Vrot/σr > 1 at all r. As such, they are not in the disk galaxy sample. |
| In the text | |
|
Fig. 2. Radial transport in a VELA disk. For the simulated galaxy VELA 7 at a redshift of z = 1.5, the top-left and -right panels show face-on maps of the cold gas surface density (Σ) and the two-dimensional radial velocity (vr,2D), respectively, within a region spanning 3 Rd × 3 Rd, centered on the galactic center. The disk is large (Rd = 18.43 kpc) and thin (Rd/Hd ∼ 9). It is mainly supported by rotation, with ⟨Vrot⟩/⟨σr⟩∼3 and has a cold gas fraction of f = 0.18. Regions with no cold gas are shown as white in the surface density map and black in the radial velocity map. Dashed red circles mark the radial extent of the disk. Both maps exhibit strong non-axisymmetry, largely due to incoming cold gas streams. The middle left and right panels display the average radial velocity (Vr, in units of Vrot) and the radial mass flux (Fr, in units of ℳ/tdyn), respectively, as functions of r, normalized by Rd, out to the disk radius. Here, Vrot and ℳ are the average rotational velocity and mass of all cold gas at r, and tdyn = r/Vrot is the local dynamical time. The non-normalized Vr and Fr are shown in the bottom left and right panels, respectively. Beyond roughly 0.2 Rd, both Vr and Vrot are negative and tend to grow in magnitude with increasing r, albeit with some fluctuations, indicating a predominantly inflow-driven cold gas radial transport within the disk. The disk-averaged radial velocity is also negative and has a magnitude about 8% of the disk-averaged rotational velocity. |
| In the text | |
|
Fig. 3. Trends with distance from the galactic center. The left and right panels respectively show the medians (solid curves) and the 16th–84th percentile ranges (shaded regions) for the average radial velocity (Vr, in units of Vrot) and the radial mass flux (Fr, in units of ℳ/tdyn) as functions of r (in units of Rd) derived from our sample of disk galaxies. The median values of both Vr and Fr are consistently negative and become more negative with increasing r, except within approximately ∼0.2 Rd, where the trend reverses. Although the 84th percentile values of both Fr and Vr are positive at all radii, the magnitudes at the 16th percentile are substantially larger. Therefore, statistically speaking, the radial transport of cold gas across our sample is dominated by inflows at all radii. |
| In the text | |
|
Fig. 4. Trends with cold gas fraction and redshift. The left and right panels show the ratio of the disk-averaged radial velocity to the disk-averaged rotational velocity, ⟨Vr⟩/⟨Vrot⟩, plotted as a function of the cold gas fraction (f) and redshift (z), respectively, using blue circles. Red squares represent the median values within bins of f and z (chosen to ensure adequate snapshot counts), while the vertical error bars correspond to the 16th–84th percentile ranges. The horizontal error bars indicate the bin widths, and the squares are placed at the mean values of f and z for each bin. For the majority of VELA disks (82%), ⟨Vr⟩ is negative (note that ⟨Vrot⟩ is strictly positive), underscoring the dominance of cold gas radial inflows over outflows in our disk galaxy sample. On average, ⟨Vr⟩/⟨Vrot⟩ becomes more negative with increasing f and z, suggesting that galaxies with higher cold gas content or located at higher redshifts typically exhibit stronger radial inflows. Although both correlations are relatively weak, the trend with cold gas fraction is stronger than that with redshift, as reflected in the Spearman rank correlation coefficients of −0.26 and −0.13, respectively. |
| In the text | |
|
Fig. 5. Comparison of disk-instability-based radial transport models with simulations. For each snapshot in our disk galaxy sample, ⟨Vr⟩/⟨Vrot⟩ versus ⟨Vrot⟩/⟨σr⟩ is plotted using blue circles. Red squares represent the medians within bins of ⟨Vrot⟩/⟨σr⟩ of varying widths, selected to ensure a reasonable number of snapshots per bin. Vertical error bars indicate the 16th–84th percentile ranges, and horizontal error bars show the bin widths. The red squares are positioned at the average ⟨Vrot⟩/⟨σr⟩ for each bin. Overlaid curves correspond to predictions from disk-instability-based models of radial inflow, as labeled. The left panel adopts Q = 0.68 (marginal instability for thick disks; Goldreich & Lynden-Bell 1965), and the right panel uses Q = 1 (marginal instability for thin disks). The D20 model describes inflow via ring migration, while the DSC09 and D13 models focus on clump migration. The KB10 and K18 models consider global gas transport in viscous disks and are likely the most applicable for comparison with the analysis of the VELA disks presented in this paper. It is worth noting that for most VELA disks, these two models tend to overestimate the disk-averaged radial inflow, regardless of whether Q = 0.68 or Q = 1 is assumed. Furthermore, all five models consistently predict radial inflows, whereas about 18% of the VELA disks show disk-averaged outflows. |
| In the text | |
|
Fig. 6. Cold gas radial mass flux versus bathtub model prediction. For the VELA disk galaxy sample, the cold gas radial flux mass at Rd, Fr = Rd, divided by the total cold gas mass within Rd, Md, is plotted as a function of the scale factor, a, with the solid black line and the envelope indicating the median and 16th − 84th percentile variation over a bins of width 0.07. The brown dot-dashed line highlights the specific accretion rate of cold gas at the disk edge, predicted by a steady-state bathtub model and ignoring any disk-instability driven mass inflows through the disk onto the central bulge or feedback-driven outflows (see D13). For comparison, the cosmological specific accretion rate of baryons onto the halo, also derived in D13, is shown with the blue, dotted line. The good agreement between the black and the brown curves highlights the importance of accreted cold gas in explaining the dynamics of VELA disks. |
| In the text | |
|
Fig. 7. Metallicity-based selection of streams. The left panel presents the two-dimensional metallicity distribution (Z2D) for the VELA 7 galaxy at a redshift of z = 1.5, shown in a face-on orientation spanning 4Rd × 4Rd and centered on the galactic center. This map was derived by computing the mass-weighted average of the cold gas metallicities (Z) along the z-axis within the vertical range of −Hd to Hd. Overlaid on the map are dashed red and cyan circles representing radii of Rd and 2Rd, respectively. The image reveals a general decline in metallicity with increasing radial distance, indicating a negative metallicity gradient. The right panel displays the mass-weighted histogram of Z for cold gas cells located between r = Rd and r = 2Rd and vertically between z = −Hd and z = Hd normalized by the total mass of cold gas in the specified volume. The black dashed vertical line at Z = 0.009 marks the 99th percentile of this distribution and serves as the threshold metallicity, Zcut, used to distinguish between stream gas (Z < Zcut) and non-stream gas (Z > Zcut). This stream selection procedure is based on the assumption that the vast majority of cold gas located beyond Rd originates from recently accreted streams. |
| In the text | |
|
Fig. 8. Streamline-based selection of streams. For the VELA 7 galaxy at a redshift z = 1.5, the figure displays path lines for a randomly selected subset of cold gas cells within the galactic disk traced backward over an average disk dynamical time scale, defined as ttrace = Rd/⟨Vrot⟩ and projected onto the x–y plane. These path lines are shown separately for streams (left panel) and non-streams (right panel). To enhance visual clarity, only a portion of the cold gas cells within the disk are included. The path lines are color coded by ±d, where d represents the distance a gas cell has traveled during ttrace, normalized by Rd. Positive values of d indicate inward motion (i.e., the 3D radius at t − ttrace is larger than at the present time), while negative values signify outward movement. Red dashed circles mark the radial boundary of the disk. A threshold value of dcut = +0.1Rd is used to distinguish inflowing streams from non-streaming gas. Most stream-classified cells (left panel) cluster into two spatially coherent inflowing structures, both showing large positive d values and entering the disk either from the top or bottom-right regions of the projection. In contrast, cells labeled as non-streams (right panel) either show minimal displacement over ttrace (d ≈ 0) or exhibit outward motion with significantly negative d values. |
| In the text | |
|
Fig. 9. Stream maps: The left, middle, and right panels respectively present the face-on maps of radial velocity (top row) and surface density (bottom row) in VELA 7 at z = 1.5, corresponding to all cold gas, streams identified via the metallicity-based method, and streams identified via the streamline-based method. To aid visual recognition of streams, the maps in the left panels are shown over an expanded area of 3Rd × 3Rd. However, the actual classification of cold gas into streams and non-streams is confined to the galactic disk, defined as a cylinder with radius Rd and height Hd, as shown in the middle and right panels. Red dashed circles denote the radial extent of this disk. In the left panels, two distinct inflowing cold gas groups are apparent (blue in the vr,2D map indicates inward motion), entering within Rd either from the top or the bottom-right and subsequently spiraling counter-clockwise toward the galactic center. The metallicity- and streamline-based classifications select somewhat different portions of these inflowing groups as streams. The areas enclosed by the orange ellipses (labeled a, b, and c) correspond to the main regions of disagreement between the two classification methods; these discrepancies are discussed further in Sect. 5.3. |
| In the text | |
|
Fig. 10. Non-stream maps. Same as in Fig. 9 except the middle and right panels now show the face-on radial velocity (top row) and surface density (bottom row) maps of the off-stream material obtained with the metallicity- and streamline-based selections, respectively. As seen in Figure 9, the metallicity- and streamline-based selections identify somewhat different regions of the cold gas as streams, automatically resulting in different non-stream identifications. The regions marked with the orange ellipses (a, b, and c) are the primary sources of disagreement between the two classification methods as discussed in Sect. 5.3. |
| In the text | |
|
Fig. 11. Stream and non-stream radial profiles. The left, middle, and right panels respectively show the radial mass flux (Fr, in units of ℳ/tdyn), average radial velocity (Vr, in units of Vrot), and mass (M, in units of ℳ), as functions of radius r, normalized by Rd, for all cold gas (black), streams (blue), and non-streams (red) in VELA 7 at z = 1.5. The top row presents results from the metallicity-based classification, and the bottom row corresponds to the streamline-based classification. In both cases, the total radial mass flux of cold gas is dominated by streams at large radii (beyond ∼0.7 Rd) and by non-streams at small radii (within ∼0.3 Rd). In the metallicity-based selection, the dominance of stream flux at large r primarily reflects the higher mass fraction of streams in that region. In contrast, the streamline-based method shows roughly equal masses for streams and non-streams at large r; however, the non-stream mass flux remains low. This is because the inflowing and outflowing contributions from non-stream gas nearly cancel out (see Fig. 10), leaving streams as the main net contributor to the total radial mass flux. |
| In the text | |
|
Fig. 12. Stream and non-stream statistics. The top, middle, and bottom rows display, respectively, the radial mass flux (Fr, in units of ℳ/tdyn), average radial velocity (Vr, in units of Vrot), and mass (M, in units of ℳ) as functions of radius, r, normalized by Rd, for streams (left panels), non-streams (middle panels), and all cold gas (right panels). Solid lines represent the median values across the disk galaxy sample, while shaded regions indicate the 16th–84th percentile ranges. The results from the metallicity-based selection are shown in blue, and those from the streamline-based selection are shown in green. In both classifications, the median cold gas mass flux at large radii is dominated by streams – beyond r ≳ 0.5Rd in the metallicity-based selection and beyond r ≳ 0.3Rd in the streamline-based selection. At smaller radii, the median stream flux approaches zero and falls below that of the non-stream component, resulting in a total cold gas flux that, while small, is primarily contributed by non-streams. The median radial velocity of streams remains predominantly negative across all radii, and its magnitude tends to exceed that of the non-streams, particularly at large r. Thus, on average, the radial transport of cold gas in the outer regions of the VELA disk galaxy sample is driven primarily by the infall of recently accreted streams. |
| In the text | |
|
Fig. 13. Positive versus negative flux. The top and bottom rows illustrate the radial mass flux (Fr, in units of ℳ/tdyn) from inflowing and outflowing regions, respectively, for streams (left panels), non-streams (middle panels), and the total cold gas (right panels), plotted as a function of radius, r, normalized by Rd. Solid lines represent the median values across the disk galaxy sample, and shaded regions correspond to the 16th–84th percentile ranges. Results from the metallicity- and streamline-based classifications are shown in blue and green, respectively. In the streamline-based selection, inflowing and outflowing fluxes from non-stream gas are nearly equal in magnitude, comparable also to the inflowing stream flux, and largely cancel each other out. This leads to a total non-stream flux that is close to zero at the median level, though it exhibits significant scatter. A similar cancellation is also observed in the metallicity-based selection, where inflowing and outflowing non-stream fluxes are also comparable but individually much smaller than the stream flux, except at small radii (r ≲ 0.5 Rd), where the stream flux diminishes. As a result, the total non-stream flux in the metallicity-based selection also approaches zero, but with minimal scatter. |
| In the text | |
|
Fig. 14. Comparison of observations with the VELA disk galaxy sample. For all cold gas (left panel), streams (middle panels), and non-streams (right panels), ⟨Vr⟩/⟨Vrot⟩ is plotted as a function of the cold gas fraction (f). Each circle represents a snapshot from the VELA disk galaxy sample and is color coded by its corresponding redshift, z. Here, ⟨Vr⟩ denotes the stream-, non-stream-, or disk-averaged radial velocity, as relevant, and ⟨Vrot⟩ is the disk-averaged rotational velocity. Red squares indicate the median values within bins of f, with vertical error bars showing the 16th–84th percentile ranges and horizontal bars reflecting the bin widths. The horizontal position of each square corresponds to the average f within that bin. Results from the metallicity-based and streamline-based classifications are shown in the top and bottom rows, respectively. For comparison, observational data from Genzel et al. (2023) are represented by green diamonds with vertical error bars. These observations are consistent with the stream-averaged radial velocities obtained from the simulations (middle panels). In contrast, the disk-averaged (left panel) and non-stream-averaged (right panels) radial velocities are generally of much smaller magnitude and show limited agreement with the observed values. |
| In the text | |
|
Fig. 15. Comparison of observations with the VELA disk galaxy sample. Same as in Figure 14 except now ⟨Vr⟩/⟨Vrot⟩ is plotted against the redshift, z, and the circles corresponding to the simulated disks are color coded by their gas fraction, f. The observations agree with the stream-averaged radial velocities found in the simulated disks (middle panels). The disk-averaged (left panel) and non-stream-averaged (right panels) radial velocities from the simulations typically have much smaller magnitudes and barely agree with the observations. |
| In the text | |
|
Fig. 16. Properties of observed disks. The left and right panels show the histograms for cold gas fraction, f, and redshift, z, for the VELA disks in red and the Genzel et al. (2023) galaxies in green. The VELA disks span a wider redshift range and have typically lower gas fractions than the Genzel et al. (2023) sample. While the lower gas fractions in VELA could potentially bias our conclusions, the simulated sample does include a few gas-rich galaxies. But the disk-averaged radial velocities in even these gas-rich galaxies barely reproduce the observations, which are much better explained when assumed to be originating from recently accreted streams. |
| In the text | |
|
Fig. A.1. Cold gas radial transport in VELA-g3 versus VELA-g6. The top and bottom rows depict the radial mass flux, Fr (in units of ℳ/tdyn), in VELA-g3 and VELA-g6 disks, respectively, with the left, middle, and right panels, respectively, focusing on streams, non-streams, and all cold gas. The solid lines indicate the medians and the envelopes represent the 16th − 84th percentile variations. Rotation-supported disks are identified from all snapshots using the procedure outlined in Section 2.3, and the results from the metallicity- and streamline-based stream selections, as described in Sections 5.2.1 and 5.2.2, are shown in blue and green, respectively. The median cold gas Fr is slightly larger in magnitude in VELA-g6 disks, especially in the outer parts (r > 0.5Rd), likely due to somewhat larger gas fractions in VELA-g6 compared to VELA-g3 (this is because of stronger stellar feedback in VELA-g6, see Fig. A.2). However, Fr is dominated by stream inflows in both VELA-g3 and VELA-g6 disks, especially in the outer parts, irrespective of the strength of stellar feedback or the details of feedback physics. |
| In the text | |
|
Fig. B.1. Cold gas radial transport in VELA-g3 with different stream selection thresholds. The top and bottom rows show the radial mass flux, Fr (in units of ℳ/tdyn) in the metallicity- and streamline-based selections, respectively, applied to VELA-g3 disks, with the left, middle, and right panels, respectively, focusing on streams, non-streams, and all cold gas. The solid lines indicate the medians and the envelopes represent the 16th − 84th percentile variations. Results are shown for Zcut = pth percentile, where p = 99 (blue), 95 (yellow), and 90 (red), and dcut = 0.05 (cyan), 0.1 (green), and 0.2Rd (brown). Here, Zcut is the threshold metallicity from the mass-weighted metallicity distribution between r = Rd to 2Rd and z = −Hd to Hd used to distinguish between streams and non-streams in the metallicity-based selection (see Section 5.2.1). Similarly, dcut is the minimum distance by which gas cells must travel inward over the average disk dynamical time to be classified as streams in the streamline-based selection (see Section 5.2.2). While the median stream signal is slightly larger in magnitude for larger values of Zcut and smaller values of dcut, the dominance of incoming streams in the cold gas radial mass flux is insensitive to the exact values adopted for the thresholds in the different stream selection procedures. |
| In the text | |
|
Fig. C.1. Comparison with disk-instability-based transport models at different radii. For each of the VELA disks, the left and middle panels plot Vr/Vrot against Vrot/σr at r = 0.5 Rd and r = Rd, respectively, with the blue, round points. The corresponding disk-averaged quantities are shown in the right panel. Red squares indicate the median values within bins of x (where x = Vrot/σr or ⟨Vrot⟩/⟨σr⟩, as applicable), with the vertical error bars highlighting the 16th − 84th percentile ranges and the horizontal error bars showing the bin widths. The disk-instability-based model predictions (see Section 4) are shown with the different curves, as labeled, assuming Q = 1. For most of the VELA disks, these models predict higher levels of inflow than that seen in the simulations, not only in a disk-averaged sense but also locally at different r. |
| In the text | |
|
Fig. D.1. Cold gas fractions in VELA-g3 versus VELA-g6. Histograms for the cold gas fractions in VELA-g3 and VELA-g6 disks are shown in red and orange, respectively. On average, gas fractions in VELA-g6 disks tend to be somewhat higher, with a median value of 0.3 as opposed to 0.2 in VELA-g3 disks. |
| In the text | |
|
Fig. D.2. Trend in disk-averaged inflow with cold gas mass. The ratio of the disk-averaged radial to rotational velocity, ⟨Vr⟩/⟨Vrot⟩, is plotted against the total cold gas mass in the disk, Md (in logarithmic units), with the blue, round points for the VELA disk galaxy sample. Red squares indicate the median values within bins of log[Md], with the vertical error bars highlighting the 16th − 84th percentile ranges and the horizontal error bars showing the bin widths. On average, with increase in Md, the magnitude of ⟨Vr⟩/⟨Vrot⟩ slightly decreases. The correlation, however, is quite weak, with a Spearman rank correlation coefficient of 0.2. |
| In the text | |
|
Fig. E.1. Mass fraction of cold gas to total disk gas. Histogram for the ratio of the mass in the cold phase (T < 1.5 × 10⁴K), Md, to the total gas mass in the disk, Mg. Atleast 80% and typically, around 85 to 90% of the disk gas mass is in the cold phase. |
| In the text | |
|
Fig. E.2. Radial transport through the disk for different gas temperature thresholds. The left panel shows the mass-weighted histogram for the disk gas temperatures for VELA 7 at z = 1.5. The brown, dashed line indicates T = 1.5 × 10⁴K, the threshold used to define the cold phase, and the cumulative mass in the cold phase is around 88% of the total gas mass in the disk. In the right panel, we plot Vr/Vrot as a function of r (in units of Rd) for three different gas temperature cuts, as labeled. There is no significant additional contribution to average radial velocities through the disk from gas above T = 1.5 × 10⁴K. |
| In the text | |
Current usage metrics show cumulative count of Article Views (full-text article views including HTML views, PDF and ePub downloads, according to the available data) and Abstracts Views on Vision4Press platform.
Data correspond to usage on the plateform after 2015. The current usage metrics is available 48-96 hours after online publication and is updated daily on week days.
Initial download of the metrics may take a while.