Fig. 15.
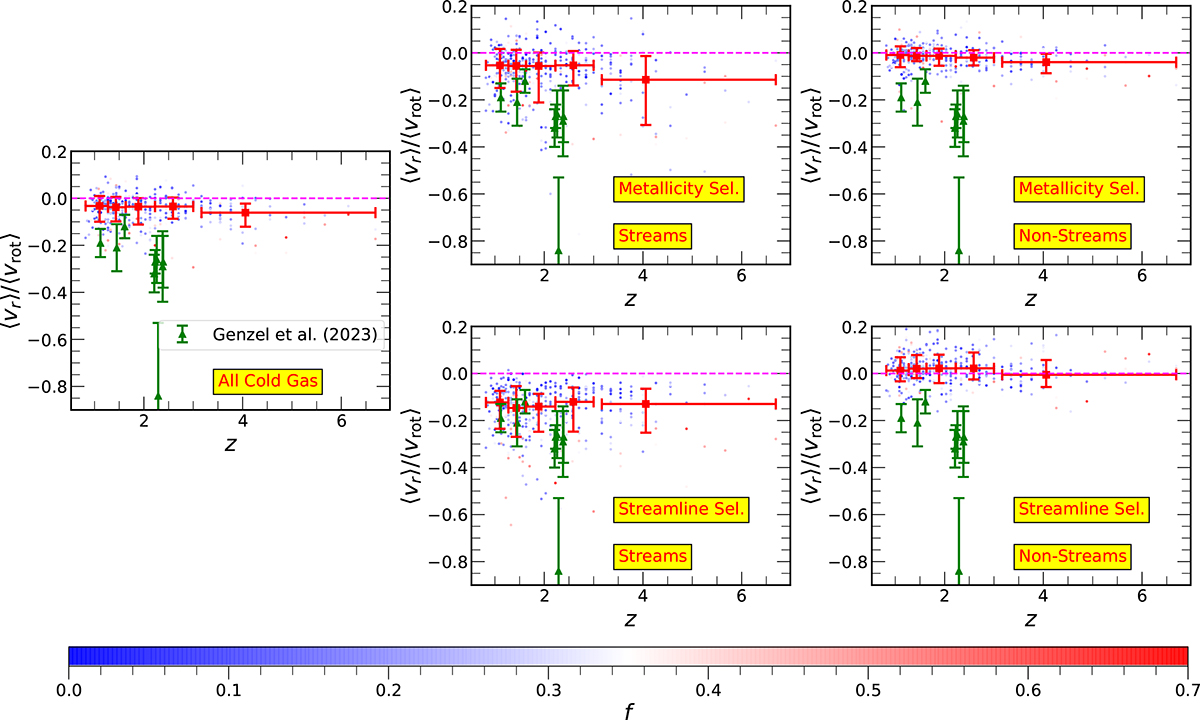
Download original image
Comparison of observations with the VELA disk galaxy sample. Same as in Figure 14 except now ⟨Vr⟩/⟨Vrot⟩ is plotted against the redshift, z, and the circles corresponding to the simulated disks are color coded by their gas fraction, f. The observations agree with the stream-averaged radial velocities found in the simulated disks (middle panels). The disk-averaged (left panel) and non-stream-averaged (right panels) radial velocities from the simulations typically have much smaller magnitudes and barely agree with the observations.
Current usage metrics show cumulative count of Article Views (full-text article views including HTML views, PDF and ePub downloads, according to the available data) and Abstracts Views on Vision4Press platform.
Data correspond to usage on the plateform after 2015. The current usage metrics is available 48-96 hours after online publication and is updated daily on week days.
Initial download of the metrics may take a while.