Fig. E.2.
Download original image
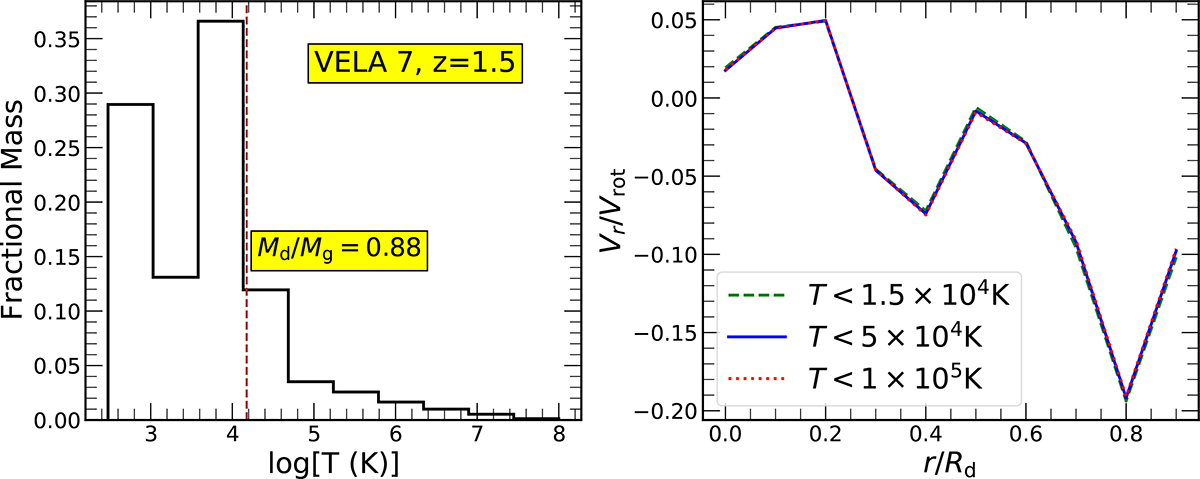
Radial transport through the disk for different gas temperature thresholds. The left panel shows the mass-weighted histogram for the disk gas temperatures for VELA 7 at z = 1.5. The brown, dashed line indicates T = 1.5 × 10⁴K, the threshold used to define the cold phase, and the cumulative mass in the cold phase is around 88% of the total gas mass in the disk. In the right panel, we plot Vr/Vrot as a function of r (in units of Rd) for three different gas temperature cuts, as labeled. There is no significant additional contribution to average radial velocities through the disk from gas above T = 1.5 × 10⁴K.
Current usage metrics show cumulative count of Article Views (full-text article views including HTML views, PDF and ePub downloads, according to the available data) and Abstracts Views on Vision4Press platform.
Data correspond to usage on the plateform after 2015. The current usage metrics is available 48-96 hours after online publication and is updated daily on week days.
Initial download of the metrics may take a while.