Fig. 4.
Download original image
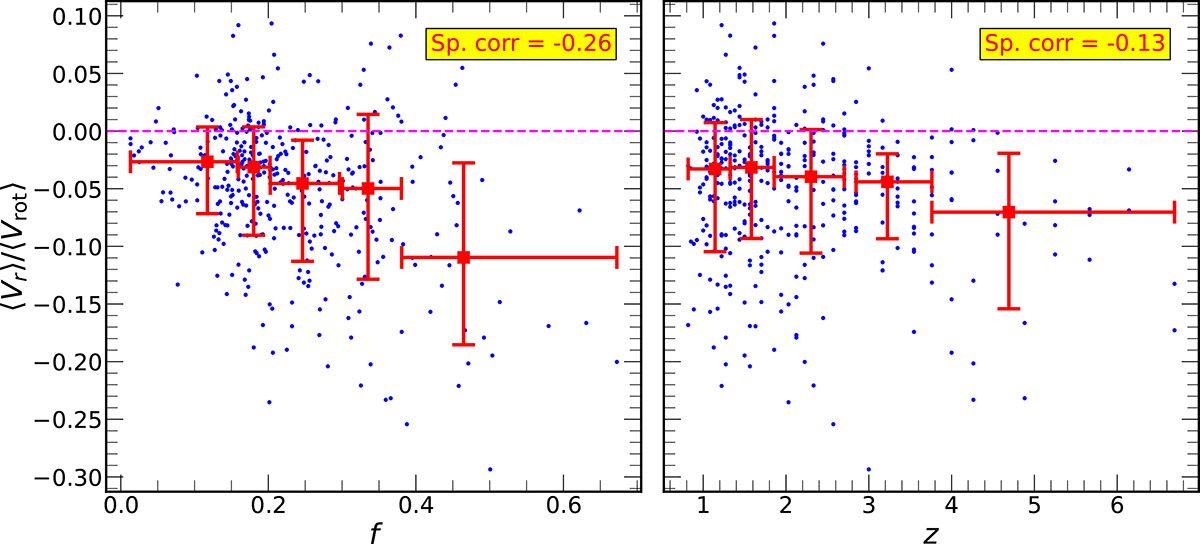
Trends with cold gas fraction and redshift. The left and right panels show the ratio of the disk-averaged radial velocity to the disk-averaged rotational velocity, ⟨Vr⟩/⟨Vrot⟩, plotted as a function of the cold gas fraction (f) and redshift (z), respectively, using blue circles. Red squares represent the median values within bins of f and z (chosen to ensure adequate snapshot counts), while the vertical error bars correspond to the 16th–84th percentile ranges. The horizontal error bars indicate the bin widths, and the squares are placed at the mean values of f and z for each bin. For the majority of VELA disks (82%), ⟨Vr⟩ is negative (note that ⟨Vrot⟩ is strictly positive), underscoring the dominance of cold gas radial inflows over outflows in our disk galaxy sample. On average, ⟨Vr⟩/⟨Vrot⟩ becomes more negative with increasing f and z, suggesting that galaxies with higher cold gas content or located at higher redshifts typically exhibit stronger radial inflows. Although both correlations are relatively weak, the trend with cold gas fraction is stronger than that with redshift, as reflected in the Spearman rank correlation coefficients of −0.26 and −0.13, respectively.
Current usage metrics show cumulative count of Article Views (full-text article views including HTML views, PDF and ePub downloads, according to the available data) and Abstracts Views on Vision4Press platform.
Data correspond to usage on the plateform after 2015. The current usage metrics is available 48-96 hours after online publication and is updated daily on week days.
Initial download of the metrics may take a while.