Fig. 5.
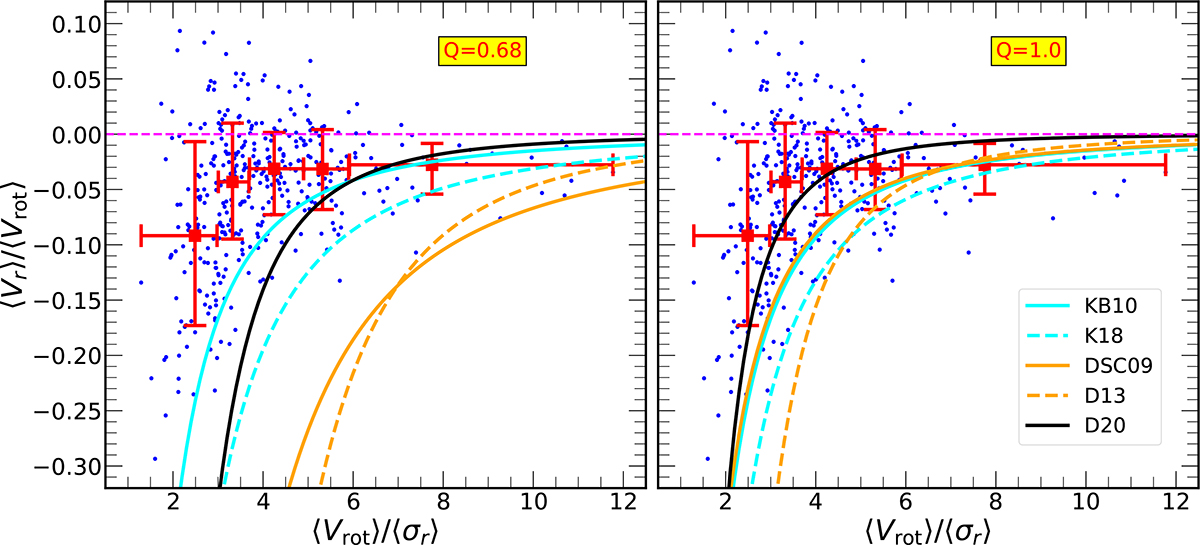
Download original image
Comparison of disk-instability-based radial transport models with simulations. For each snapshot in our disk galaxy sample, ⟨Vr⟩/⟨Vrot⟩ versus ⟨Vrot⟩/⟨σr⟩ is plotted using blue circles. Red squares represent the medians within bins of ⟨Vrot⟩/⟨σr⟩ of varying widths, selected to ensure a reasonable number of snapshots per bin. Vertical error bars indicate the 16th–84th percentile ranges, and horizontal error bars show the bin widths. The red squares are positioned at the average ⟨Vrot⟩/⟨σr⟩ for each bin. Overlaid curves correspond to predictions from disk-instability-based models of radial inflow, as labeled. The left panel adopts Q = 0.68 (marginal instability for thick disks; Goldreich & Lynden-Bell 1965), and the right panel uses Q = 1 (marginal instability for thin disks). The D20 model describes inflow via ring migration, while the DSC09 and D13 models focus on clump migration. The KB10 and K18 models consider global gas transport in viscous disks and are likely the most applicable for comparison with the analysis of the VELA disks presented in this paper. It is worth noting that for most VELA disks, these two models tend to overestimate the disk-averaged radial inflow, regardless of whether Q = 0.68 or Q = 1 is assumed. Furthermore, all five models consistently predict radial inflows, whereas about 18% of the VELA disks show disk-averaged outflows.
Current usage metrics show cumulative count of Article Views (full-text article views including HTML views, PDF and ePub downloads, according to the available data) and Abstracts Views on Vision4Press platform.
Data correspond to usage on the plateform after 2015. The current usage metrics is available 48-96 hours after online publication and is updated daily on week days.
Initial download of the metrics may take a while.