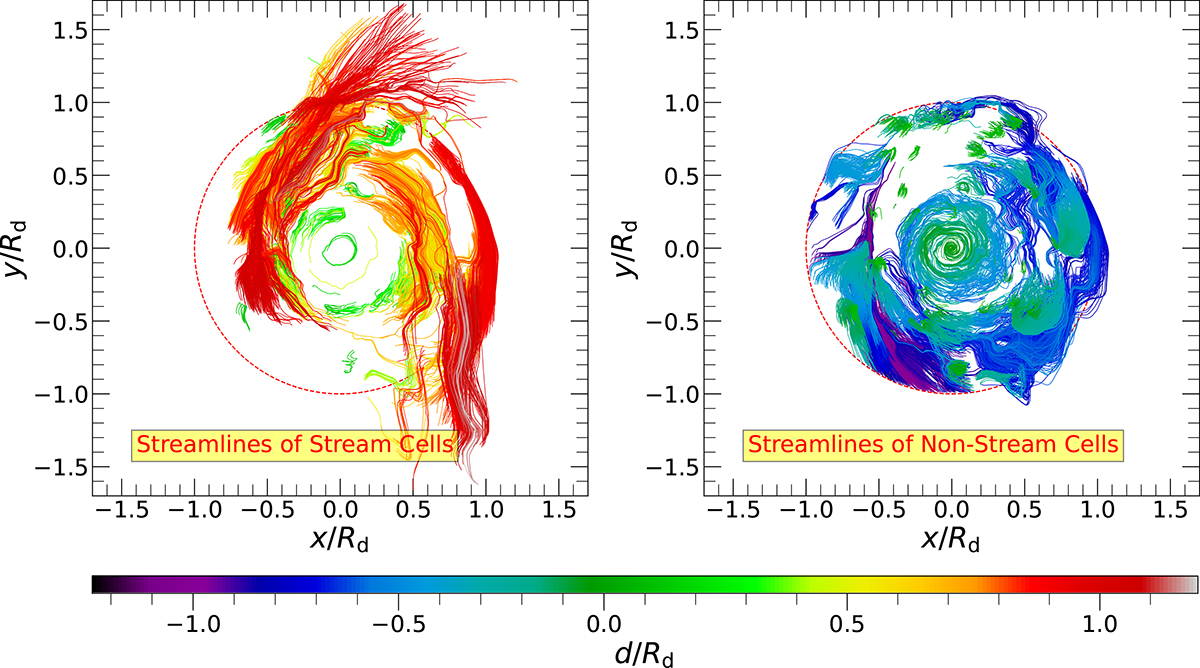
Fig. 8.
Download original image
Streamline-based selection of streams. For the VELA 7 galaxy at a redshift z = 1.5, the figure displays path lines for a randomly selected subset of cold gas cells within the galactic disk traced backward over an average disk dynamical time scale, defined as ttrace = Rd/⟨Vrot⟩ and projected onto the x–y plane. These path lines are shown separately for streams (left panel) and non-streams (right panel). To enhance visual clarity, only a portion of the cold gas cells within the disk are included. The path lines are color coded by ±d, where d represents the distance a gas cell has traveled during ttrace, normalized by Rd. Positive values of d indicate inward motion (i.e., the 3D radius at t − ttrace is larger than at the present time), while negative values signify outward movement. Red dashed circles mark the radial boundary of the disk. A threshold value of dcut = +0.1Rd is used to distinguish inflowing streams from non-streaming gas. Most stream-classified cells (left panel) cluster into two spatially coherent inflowing structures, both showing large positive d values and entering the disk either from the top or bottom-right regions of the projection. In contrast, cells labeled as non-streams (right panel) either show minimal displacement over ttrace (d ≈ 0) or exhibit outward motion with significantly negative d values.
Current usage metrics show cumulative count of Article Views (full-text article views including HTML views, PDF and ePub downloads, according to the available data) and Abstracts Views on Vision4Press platform.
Data correspond to usage on the plateform after 2015. The current usage metrics is available 48-96 hours after online publication and is updated daily on week days.
Initial download of the metrics may take a while.