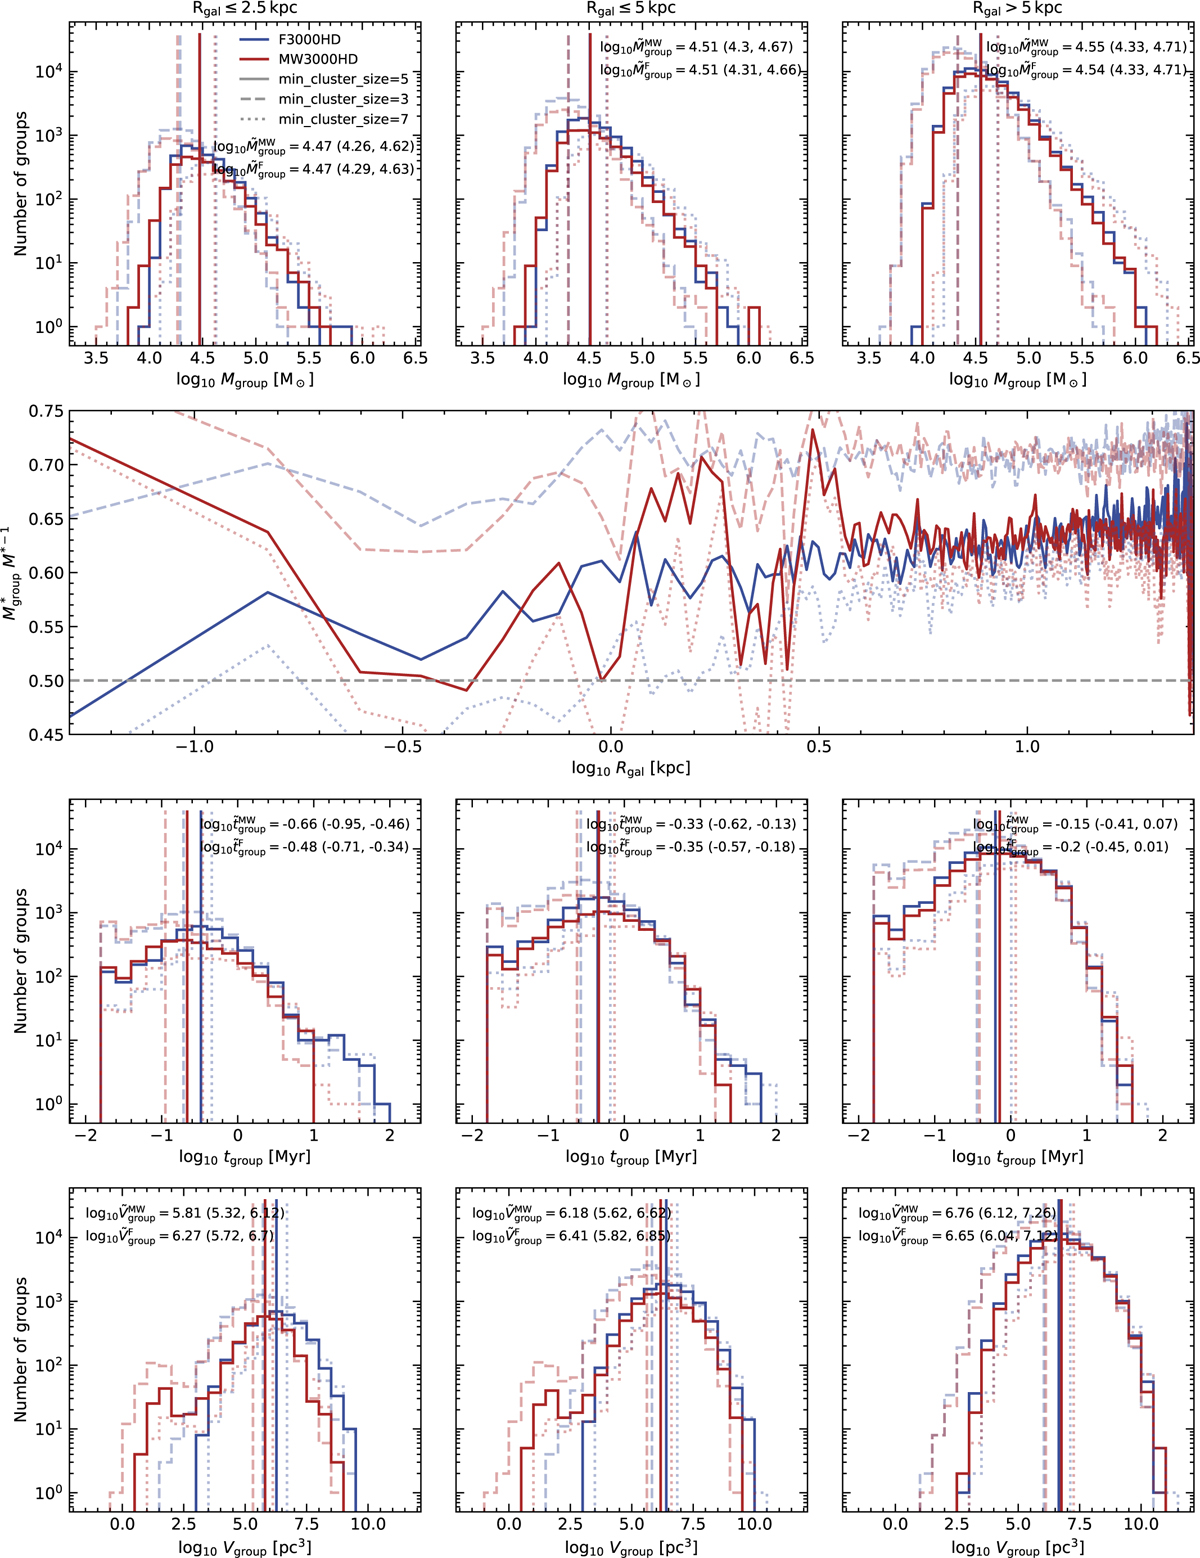
Fig. 11
Download original image
Grouped star formation: mass of group (first row), mass fraction of stars born in groups (second row), activity time (third row), and volume of groups (fourth row) for F3000HD (blue) and MW3000HD (red) in the Galactic centre (≤2.5 kpc, left column), inner region (≤5 kpc, middle column), and disc (>5 kpc, right column). Vertical lines indicate median values, which are written out at the upper left or right. Faint lines indicate distributions and medians for a min_cluster_size of three (dashed) and seven (dotted). The corresponding median values are given in brackets.
Current usage metrics show cumulative count of Article Views (full-text article views including HTML views, PDF and ePub downloads, according to the available data) and Abstracts Views on Vision4Press platform.
Data correspond to usage on the plateform after 2015. The current usage metrics is available 48-96 hours after online publication and is updated daily on week days.
Initial download of the metrics may take a while.