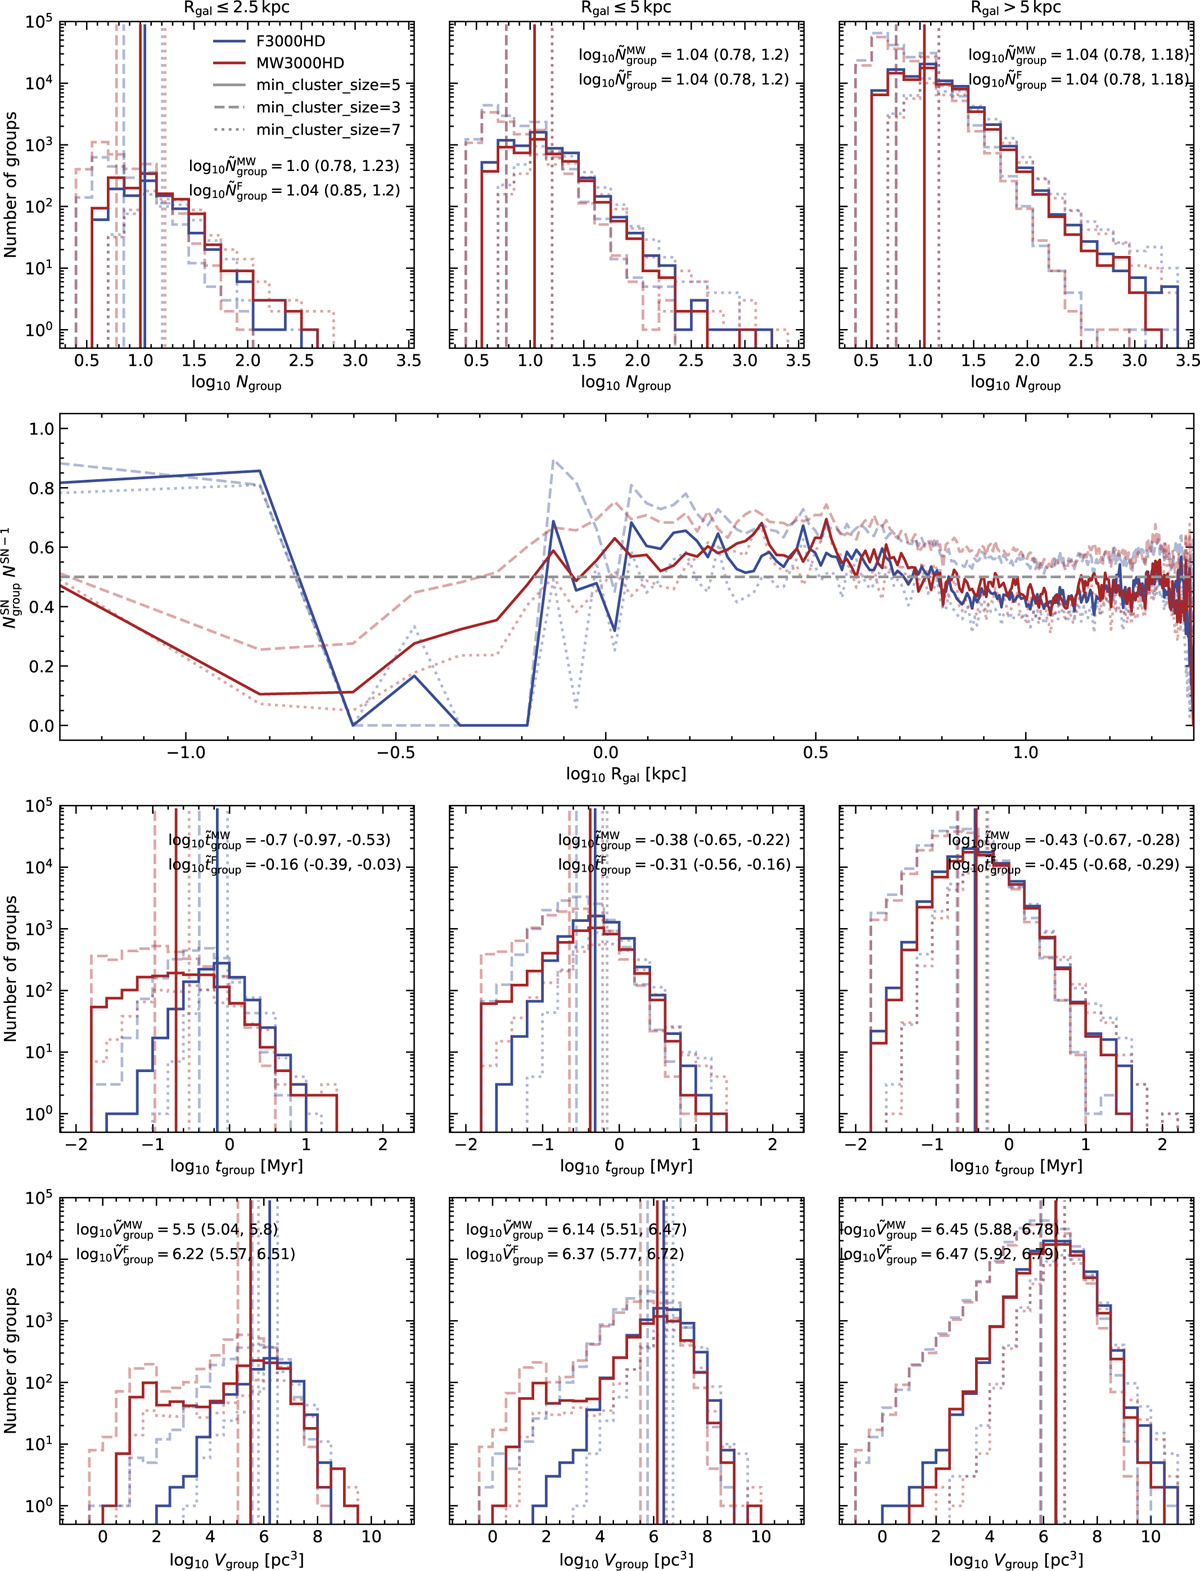
Fig. 12
Download original image
Grouped supernovae: number of association members (top row), fraction of supernova exploding within groups (second row), activity time (third row), and extend of groups (fourth row) for F3000HD and MW3000HD for t = 2450–2550 Myr. Vertical lines indicate median values. Faint lines indicate distributions and medians for a min_cluster_size of 3 (dashed) and 7 (dotted). Corresponding median values are given in brackets.
Current usage metrics show cumulative count of Article Views (full-text article views including HTML views, PDF and ePub downloads, according to the available data) and Abstracts Views on Vision4Press platform.
Data correspond to usage on the plateform after 2015. The current usage metrics is available 48-96 hours after online publication and is updated daily on week days.
Initial download of the metrics may take a while.