Fig. 6
Download original image
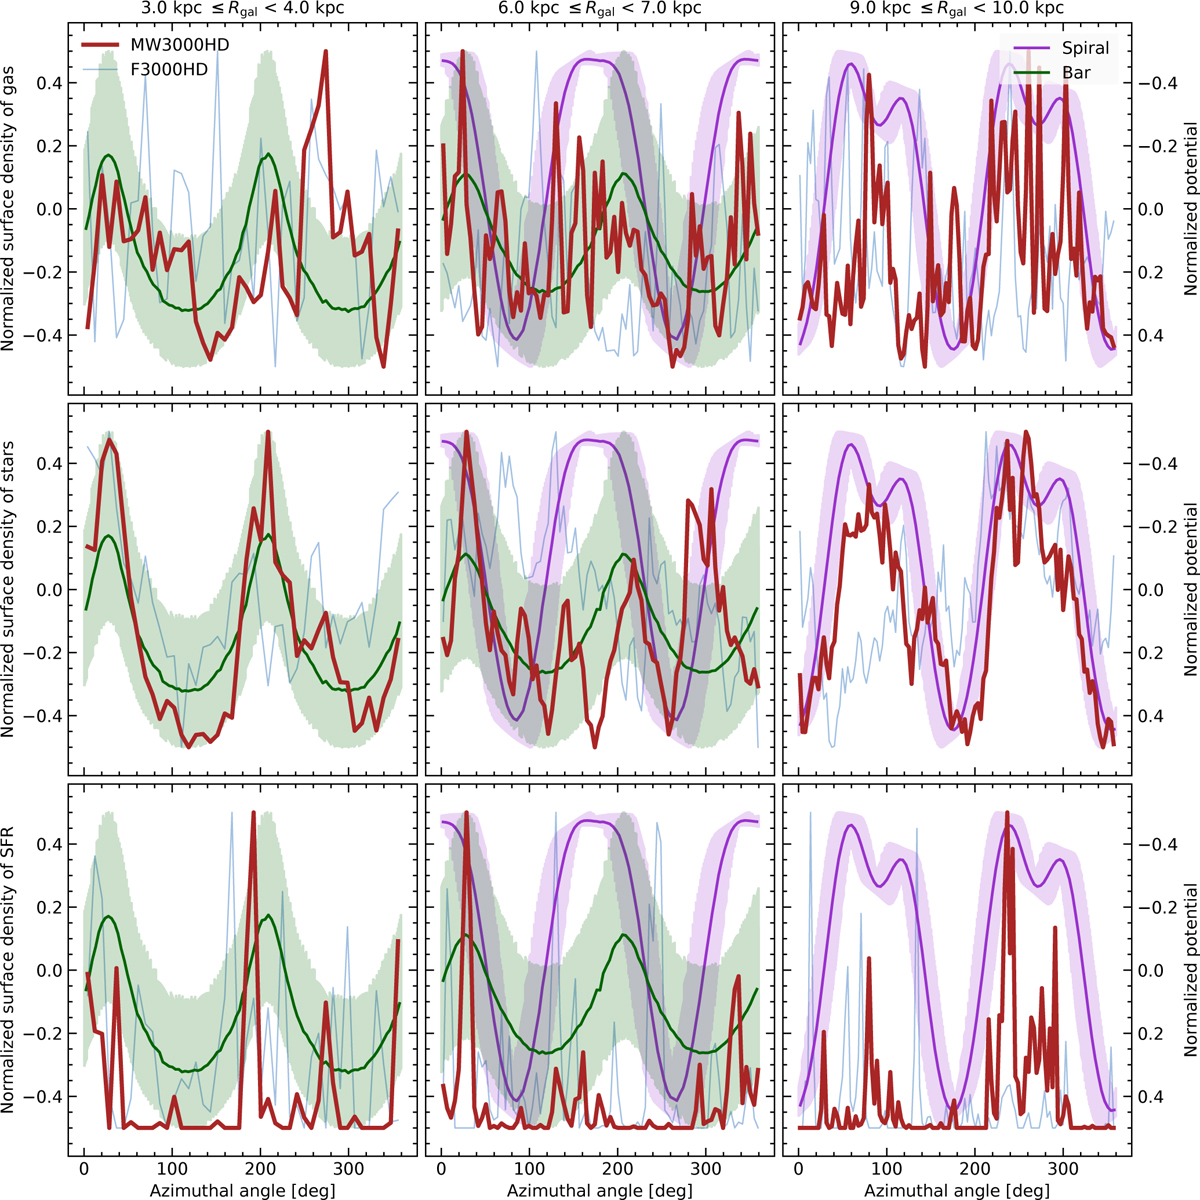
Azimuthal profile of the normalised fluctuations of the gas (top), stars (middle), and SFR (bottom) surface densities at t = 2500 Myr. These are compared with the normalised fluctuations of the contributions of the external non-axisymmetric components of the potential, with the bar (green) and the spirals (pink), associated with the right vertical axis of each panel, which is reversed so that lower values are on top. The data have been averaged over a radius range of 1 kpc, and the shaded area represents the radial variations.
Current usage metrics show cumulative count of Article Views (full-text article views including HTML views, PDF and ePub downloads, according to the available data) and Abstracts Views on Vision4Press platform.
Data correspond to usage on the plateform after 2015. The current usage metrics is available 48-96 hours after online publication and is updated daily on week days.
Initial download of the metrics may take a while.