Fig. 16
Download original image
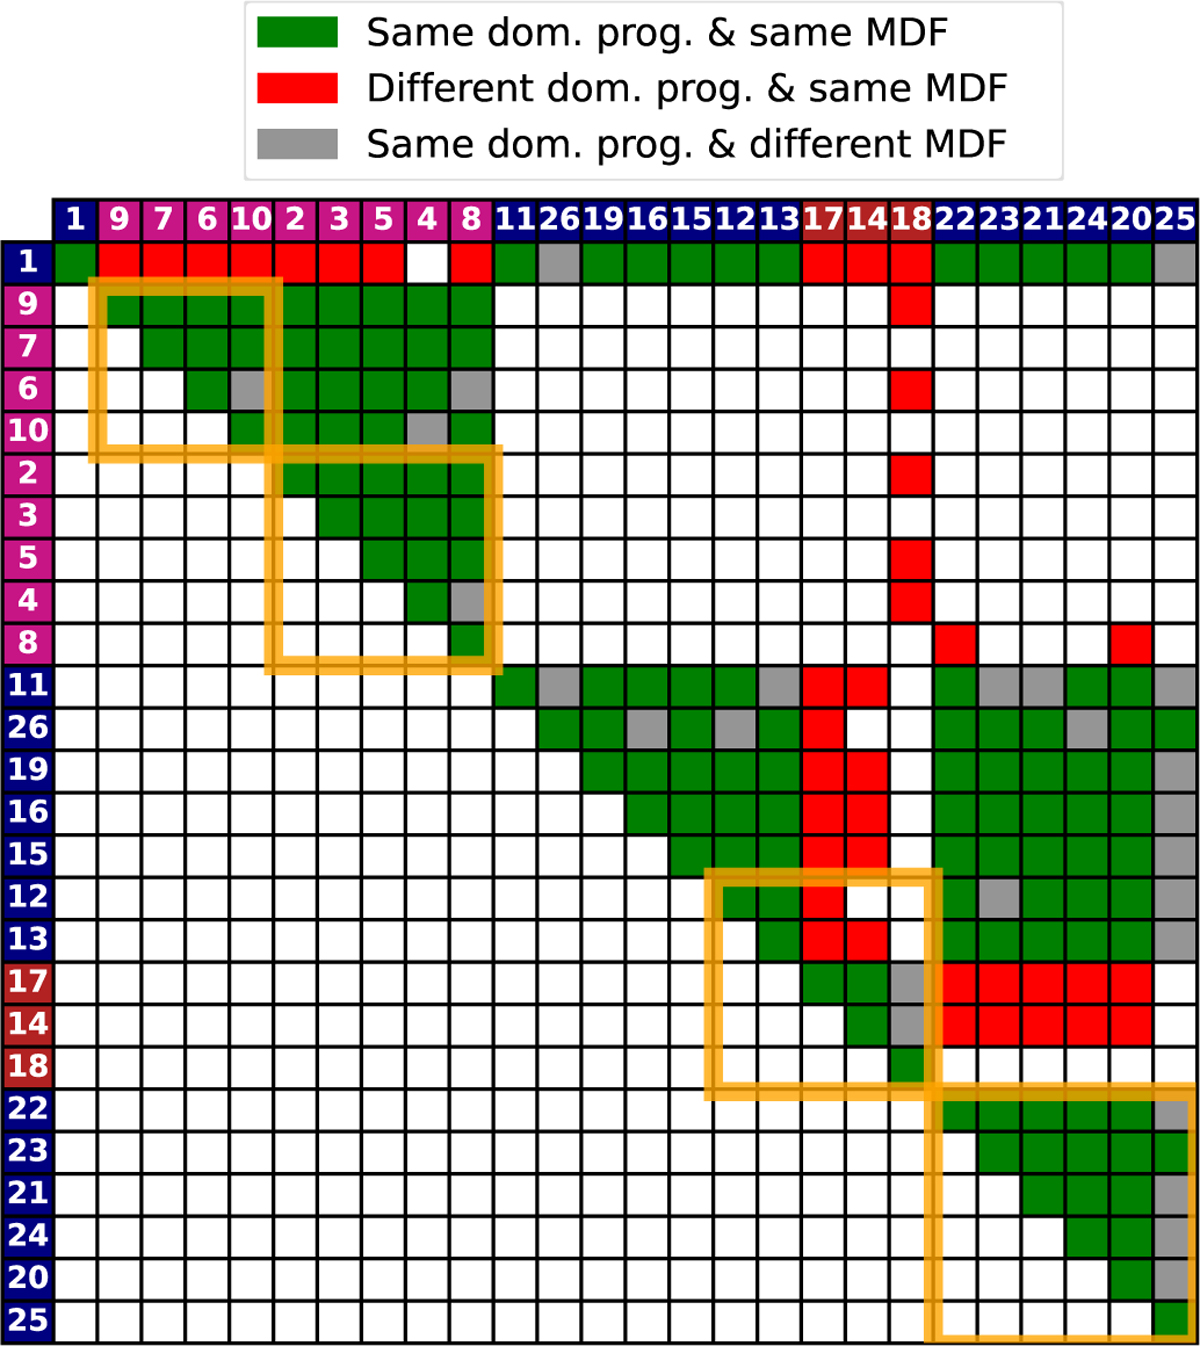
Confusion matrix of the KS test, comparing the MDF of each significant cluster found in Au. 27 considering only particles from accreted progenitors. The green cells indicate pairs of clusters sharing the same dominant progenitor and which have a similar MDF at the 95% confidence level (p-value >0.05, true positive). The red cells show pairs of clusters with a similar MDF but with different dominant progenitor (false positive). The grey cells show the pair of clusters with the same dominant progenitor but with different MDF at the 95% confidence level (false negative). The pair of clusters that are not dominated by the same progenitor and that have not the same MDF at the 95% confidence level (true negative) are shown by the white cells. As the matrix is diagonally symmetric, we decided to not colour code the cells in the lower part of the matrix for visibility reasons. The orange rectangles show the groups of clusters linked together by the Mahalanobis distance using the same cut-off value of D23. The clusters are ordered in the same way that in Fig. 8, with their reference ID. indicated in each row and column.
Current usage metrics show cumulative count of Article Views (full-text article views including HTML views, PDF and ePub downloads, according to the available data) and Abstracts Views on Vision4Press platform.
Data correspond to usage on the plateform after 2015. The current usage metrics is available 48-96 hours after online publication and is updated daily on week days.
Initial download of the metrics may take a while.