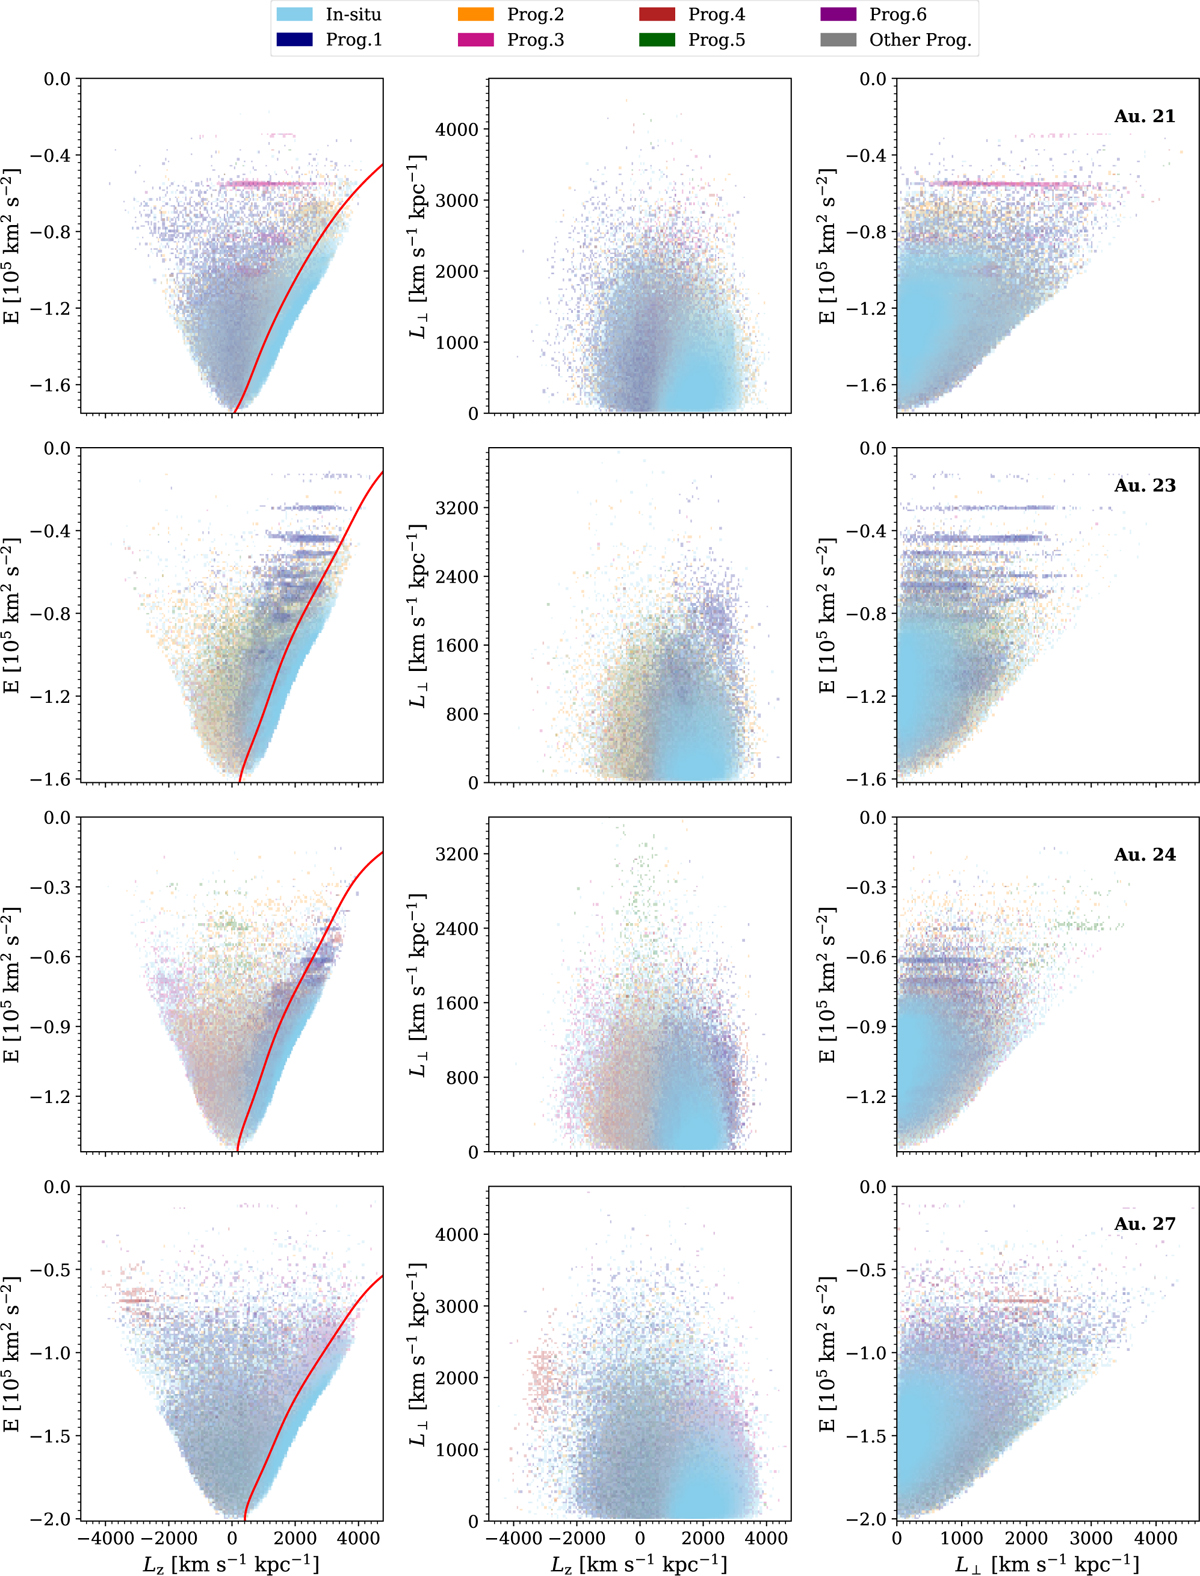
Fig. 3
Download original image
Dominance diagrams of IoM space of the solar vicinity for the four simulated galaxies analysed. Each progenitor is identified by a specific colour, as indicated in the legend. In these diagrams, the local uniqueness of a colour indicates that the region is mainly populated by particles originating from a single progenitor. On the contrary, regions where particles have different origins are identified by areas with blended colours, proportional to the local contribution of each progenitor. The density variation is logarithmically proportional to the colour opacity. The red line on the left panels indicates the approximate limit of the kinematically selected halo (see Section 3.1).
Current usage metrics show cumulative count of Article Views (full-text article views including HTML views, PDF and ePub downloads, according to the available data) and Abstracts Views on Vision4Press platform.
Data correspond to usage on the plateform after 2015. The current usage metrics is available 48-96 hours after online publication and is updated daily on week days.
Initial download of the metrics may take a while.