Fig. 8
Download original image
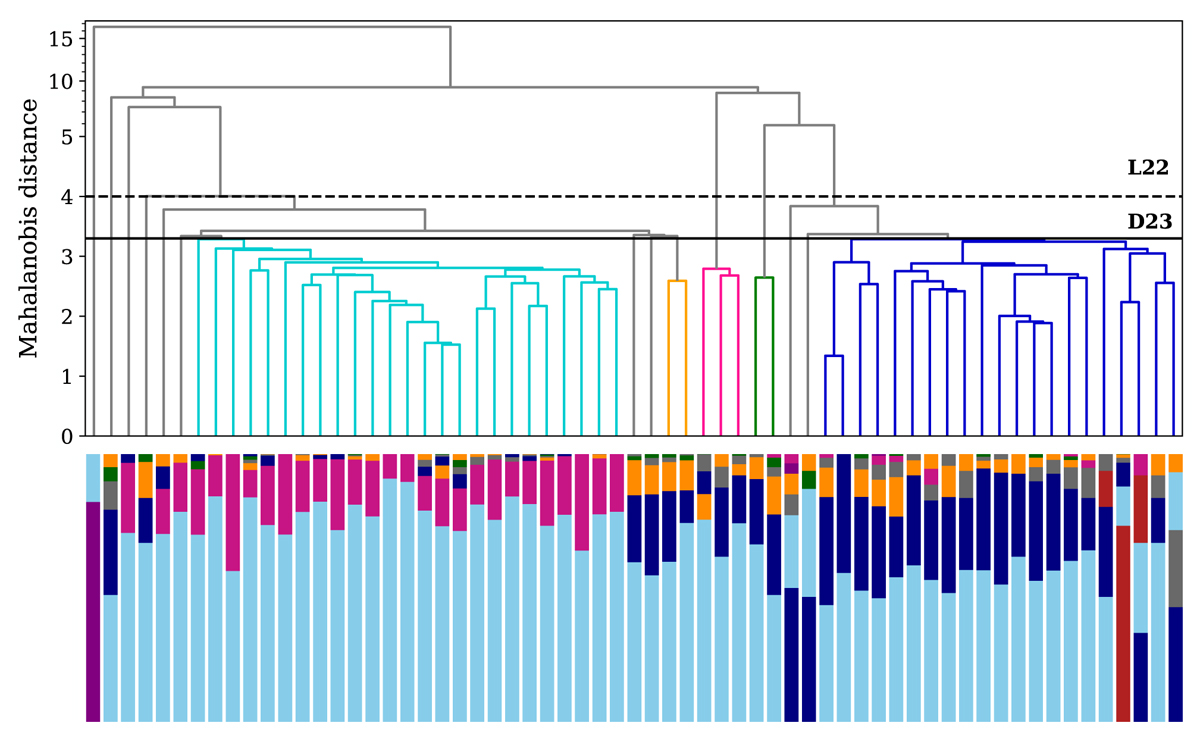
Dendrogram (similar to Fig. 10 of L22) showing the relationship between the significant clusters detected by the single linkage algorithm according to their Mahalanobis distance in the IoM space, with the same cut-off threshold as used by D23 (indicated by the black line). For reference, the cut-off threshold used by L22 is shown by the dashed line. The vertical bars at the bottom of the figure indicate the relative contribution of the different progenitors to each significant cluster, using the same colour scheme as in Fig. 3. Note: the colours used to indicate the different groups of clusters linked together in the dendrogram are not related to the progenitors.
Current usage metrics show cumulative count of Article Views (full-text article views including HTML views, PDF and ePub downloads, according to the available data) and Abstracts Views on Vision4Press platform.
Data correspond to usage on the plateform after 2015. The current usage metrics is available 48-96 hours after online publication and is updated daily on week days.
Initial download of the metrics may take a while.