Fig. 1.
Download original image
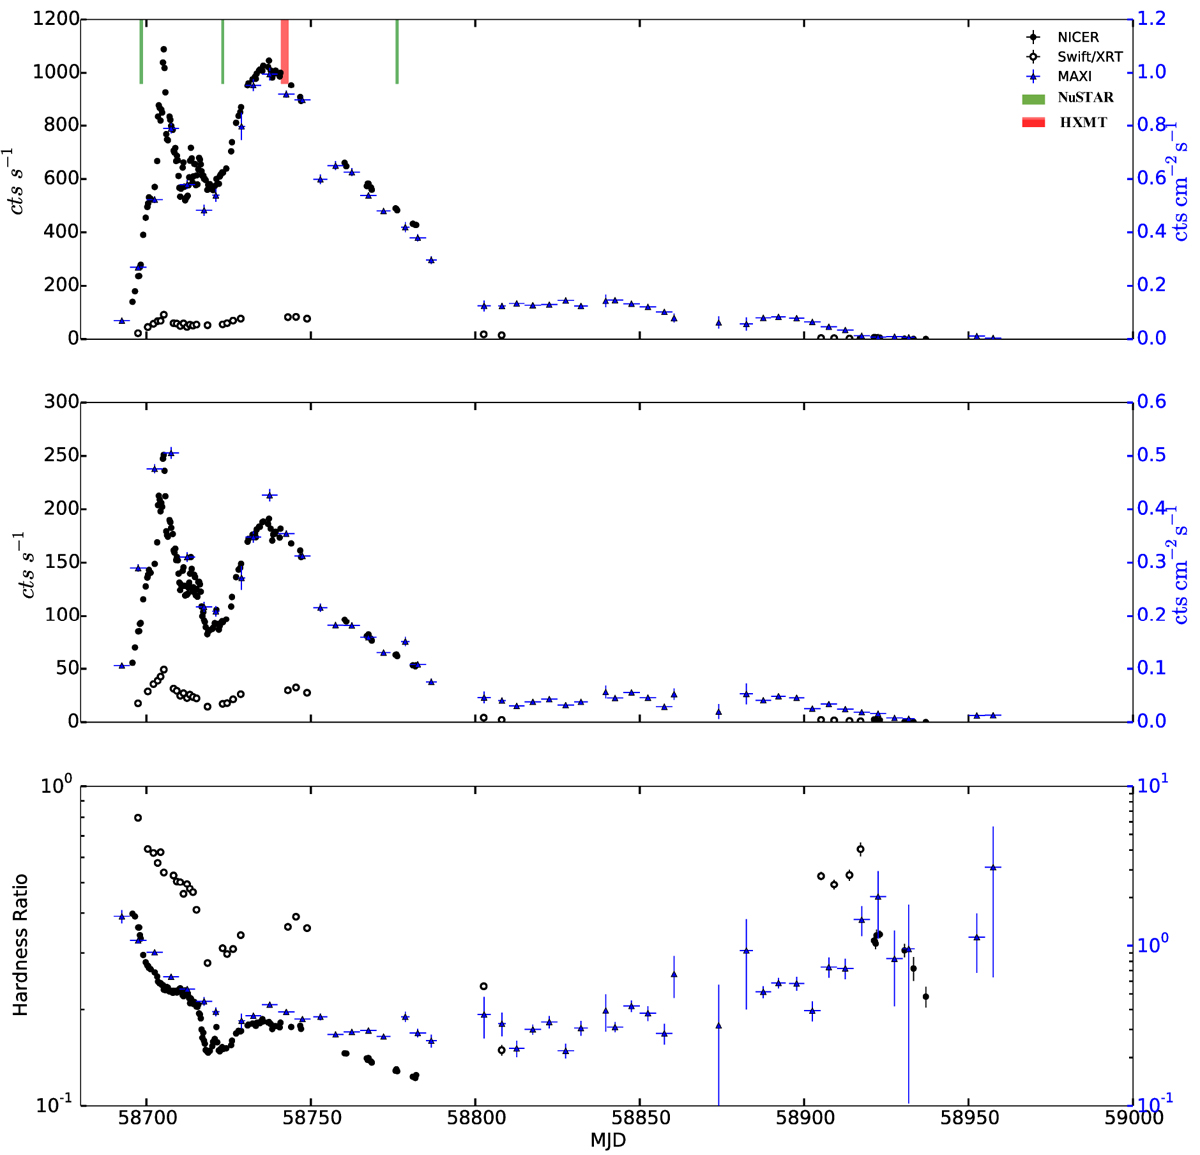
Light curves and hardness ratios of EXO 1846−031 during its 2019 outburst as functions of MJD. Top panel shows the light curves in the soft bands: 0.3 − 4 keV for NICER/XTI and Swift/XRT; 2 − 4 keV for MAXI/GSC. Middle panel shows the light curves in hard bands: 4 − 6 keV for NICER/XTI, 4 − 10 keV for Swift/XRT and MAXI/GSC. Bottom panel shows the corresponding hardness ratio for NICER/XTI (4 − 6 keV/0.3 − 4 keV), Swift/XRT (4 − 10 keV/0.3 − 4 keV), and MAXI/GSC (4 − 10 keV/2 − 4 keV), respectively. The NICER (black circles) and Swift data (open circles) are depicted on the left y-axis, and the MAXI data (blue triangles) are depicted on the right y-axis. The green and red bars represent the times of the NuSTAR and HXMT observations.
Current usage metrics show cumulative count of Article Views (full-text article views including HTML views, PDF and ePub downloads, according to the available data) and Abstracts Views on Vision4Press platform.
Data correspond to usage on the plateform after 2015. The current usage metrics is available 48-96 hours after online publication and is updated daily on week days.
Initial download of the metrics may take a while.