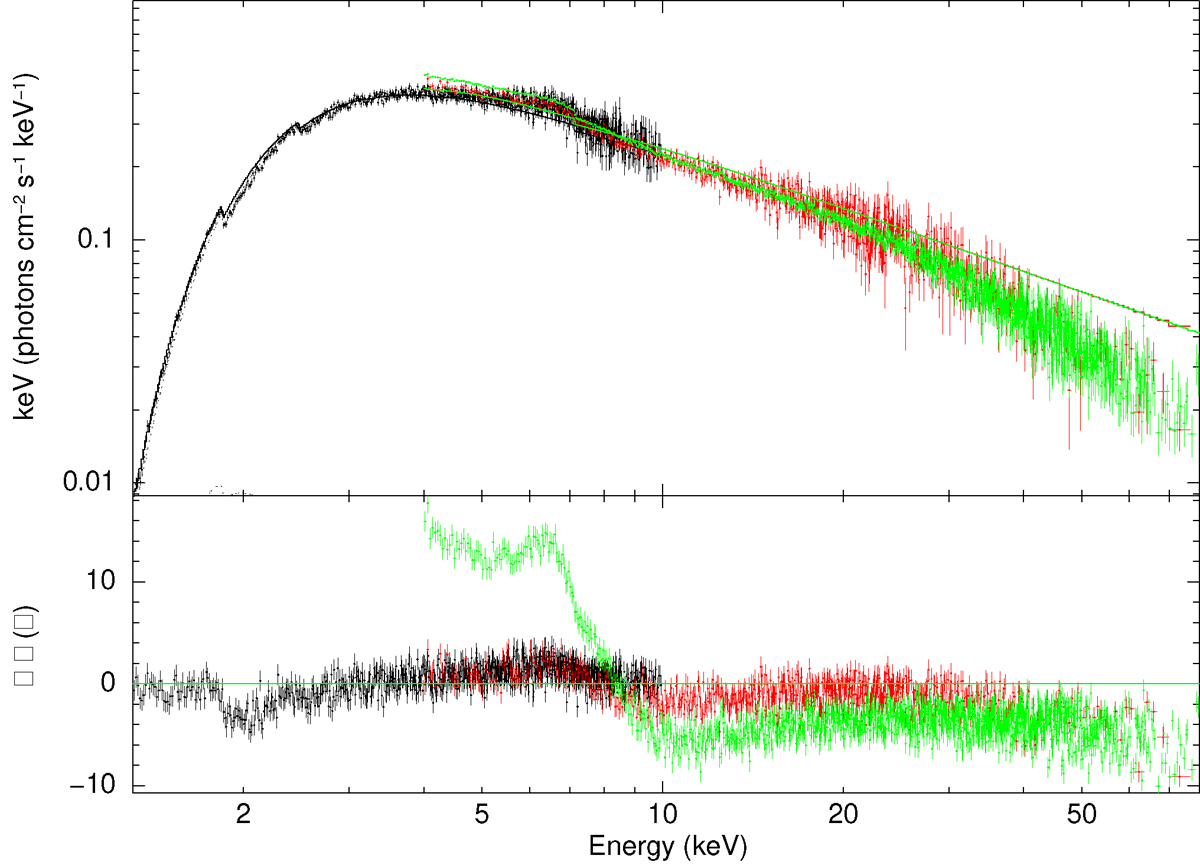
Fig. 5.
Download original image
Simultaneous NuSTAR/FPMA and NICER/XTI spectra at MJD 58698.1 fitted with a complex model of constant*TBabs*(diskbb+power-law). The black data points represent the NICER/XTI (1.3–10 keV) spectrum with observation ID 2200760104. The green data points represent the NuSTAR/FPMA spectrum (4–79 keV) with the observation ID 90501334002. The red data points represent the NuSTAR/FPMA spectrum with the same NuSTAR observation ID as that of green points but having the exactly same observation period as that of NICER spectrum.
Current usage metrics show cumulative count of Article Views (full-text article views including HTML views, PDF and ePub downloads, according to the available data) and Abstracts Views on Vision4Press platform.
Data correspond to usage on the plateform after 2015. The current usage metrics is available 48-96 hours after online publication and is updated daily on week days.
Initial download of the metrics may take a while.