Fig. 6.
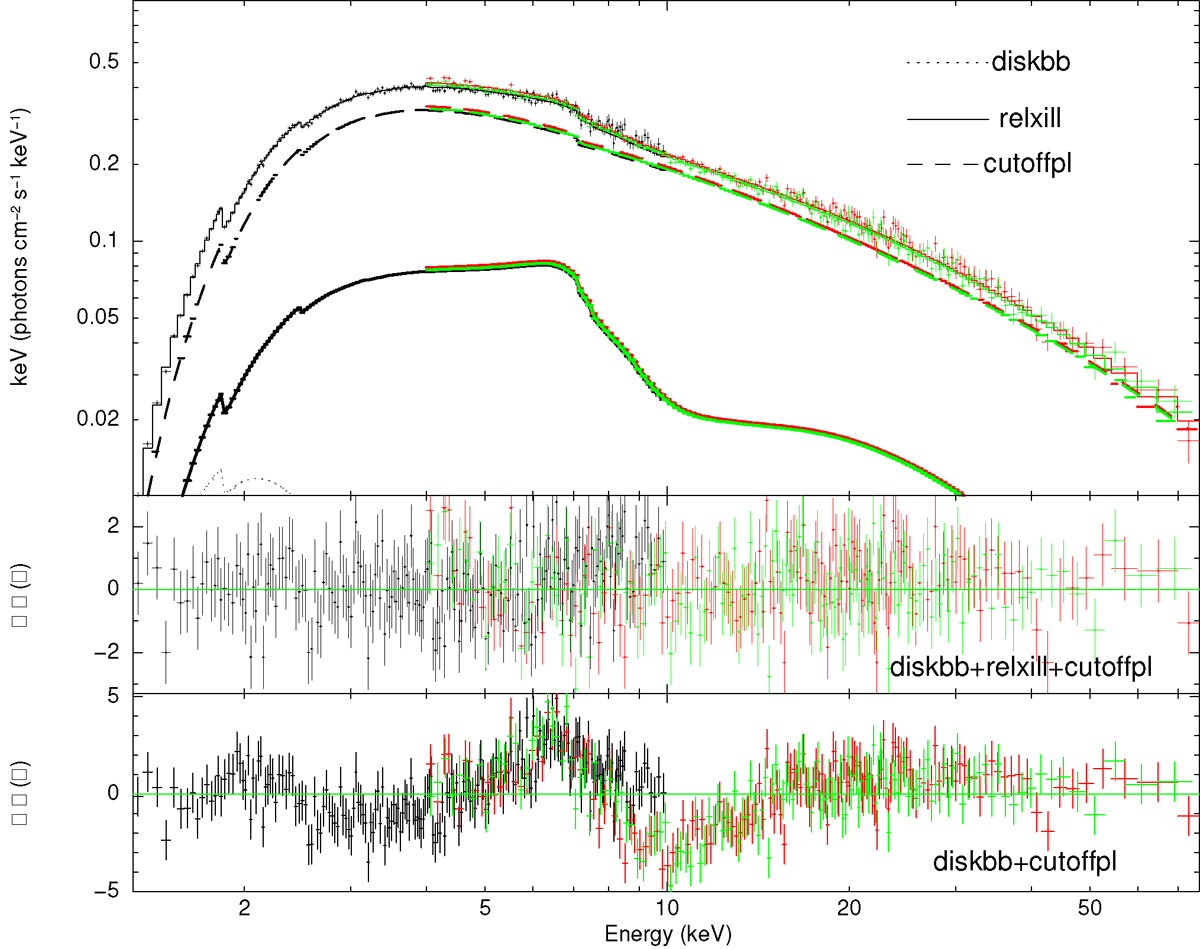
Download original image
Joint NICER+NuSTAR spectrum fitted with the diskbb+relxill+cutoff power-law model for X1 observation, where the NICER data is marked in black, NuSTAR/FPMA is marked in red and NuSTAR/FPMB is marked in green. The disk component is represented by dotted line, the nonthermal component is represented by dashed line and the reflection model is represented by solid line. The goodness of fit with diskbb+cutoffpl model is shown in the bottom panel for compassion. The bins in the figure are plotted that have at least 50 sigma, or are grouped in sets of five bins, to make the goodness of fit easier to compare.
Current usage metrics show cumulative count of Article Views (full-text article views including HTML views, PDF and ePub downloads, according to the available data) and Abstracts Views on Vision4Press platform.
Data correspond to usage on the plateform after 2015. The current usage metrics is available 48-96 hours after online publication and is updated daily on week days.
Initial download of the metrics may take a while.