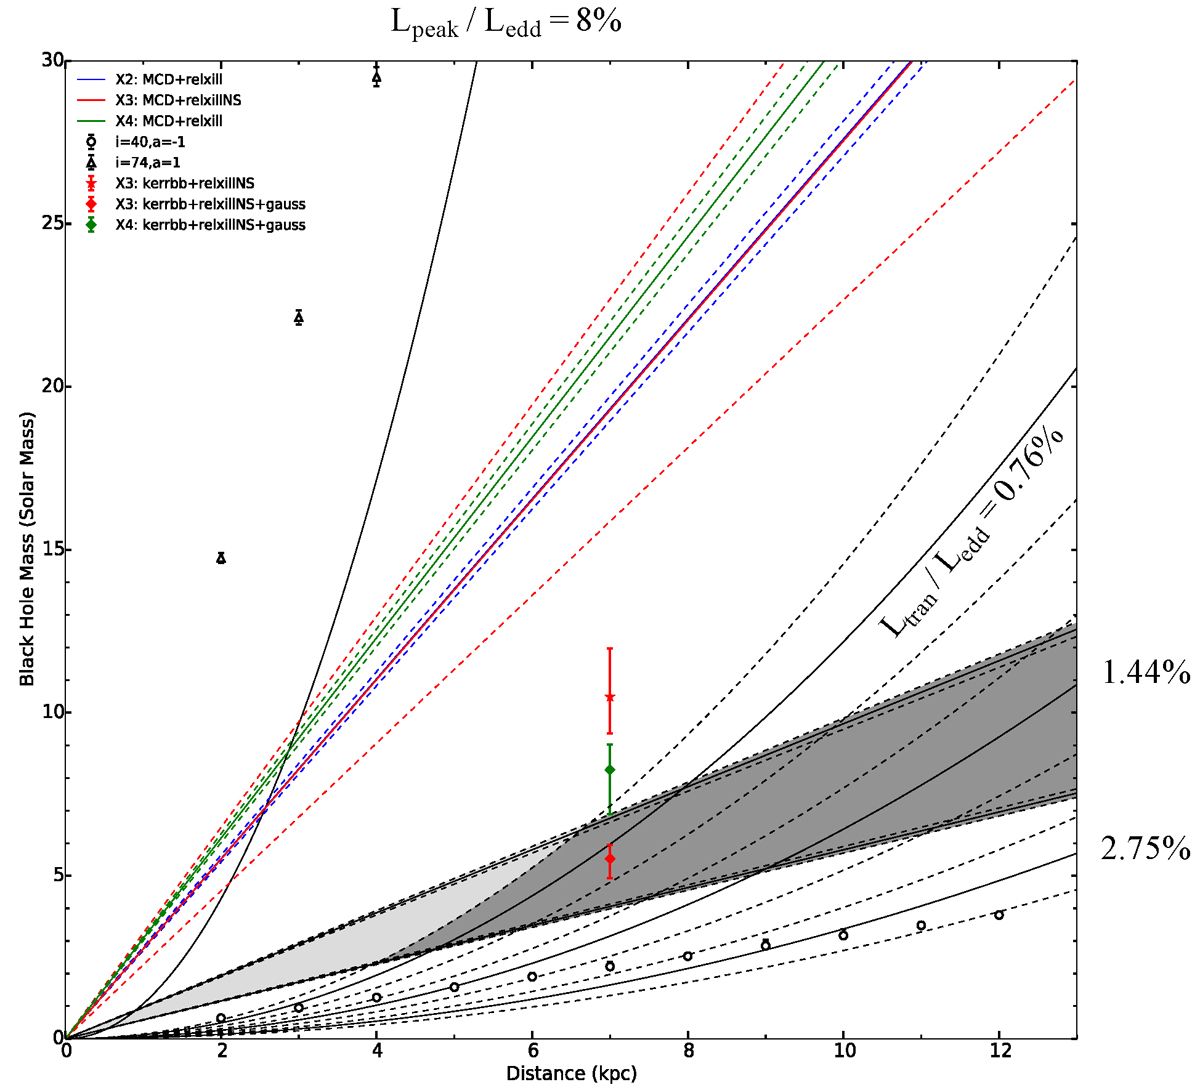
Fig. 7.
Download original image
Black hole masses of EXO 1846−031 obtained from X-ray observations. The black straight lines represent the black hole masses estimated using the RISCO derived from diskbb model fittings with NICER spectra, assuming the inclination range of 40° −74° and a non-spinning black hole. The dark grey region shows the mass range additionally satisfying the empirical condition of index transition luminosity estimated from the Swift/XRT spectrum. Each solid black curve in the bottom region indicates the constraint on black hole mass for different Eddington ratios (0.76%, 1.44%, and 2.75%) of the transition luminosity Ltran. The 90% confidence ranges are shown with accompanying dashed black curves. The solid curve marked with Lpeak/LEdd = 8% indicates the upper limit of mass estimated assuming the peak luminosity occurs at 8%LEdd and a high inclination of 74°. The colored straight lines represent the masses estimated using the RISCO and spin obtained from the diskbb+reflection models for X2, X3 and X4 observations. Their corresponding 90% confidence ranges are shown with accompanying dashed lines in the same colors. The red star mark the black hole masses suggested by the kerrbb+relxillNS model (a = 0.998) for X3. For reference, the masses suggested by the kerrbb+relxillNS+gauss model (a = 0.998) for X3 and X4 are shown with colored diamonds.
Current usage metrics show cumulative count of Article Views (full-text article views including HTML views, PDF and ePub downloads, according to the available data) and Abstracts Views on Vision4Press platform.
Data correspond to usage on the plateform after 2015. The current usage metrics is available 48-96 hours after online publication and is updated daily on week days.
Initial download of the metrics may take a while.