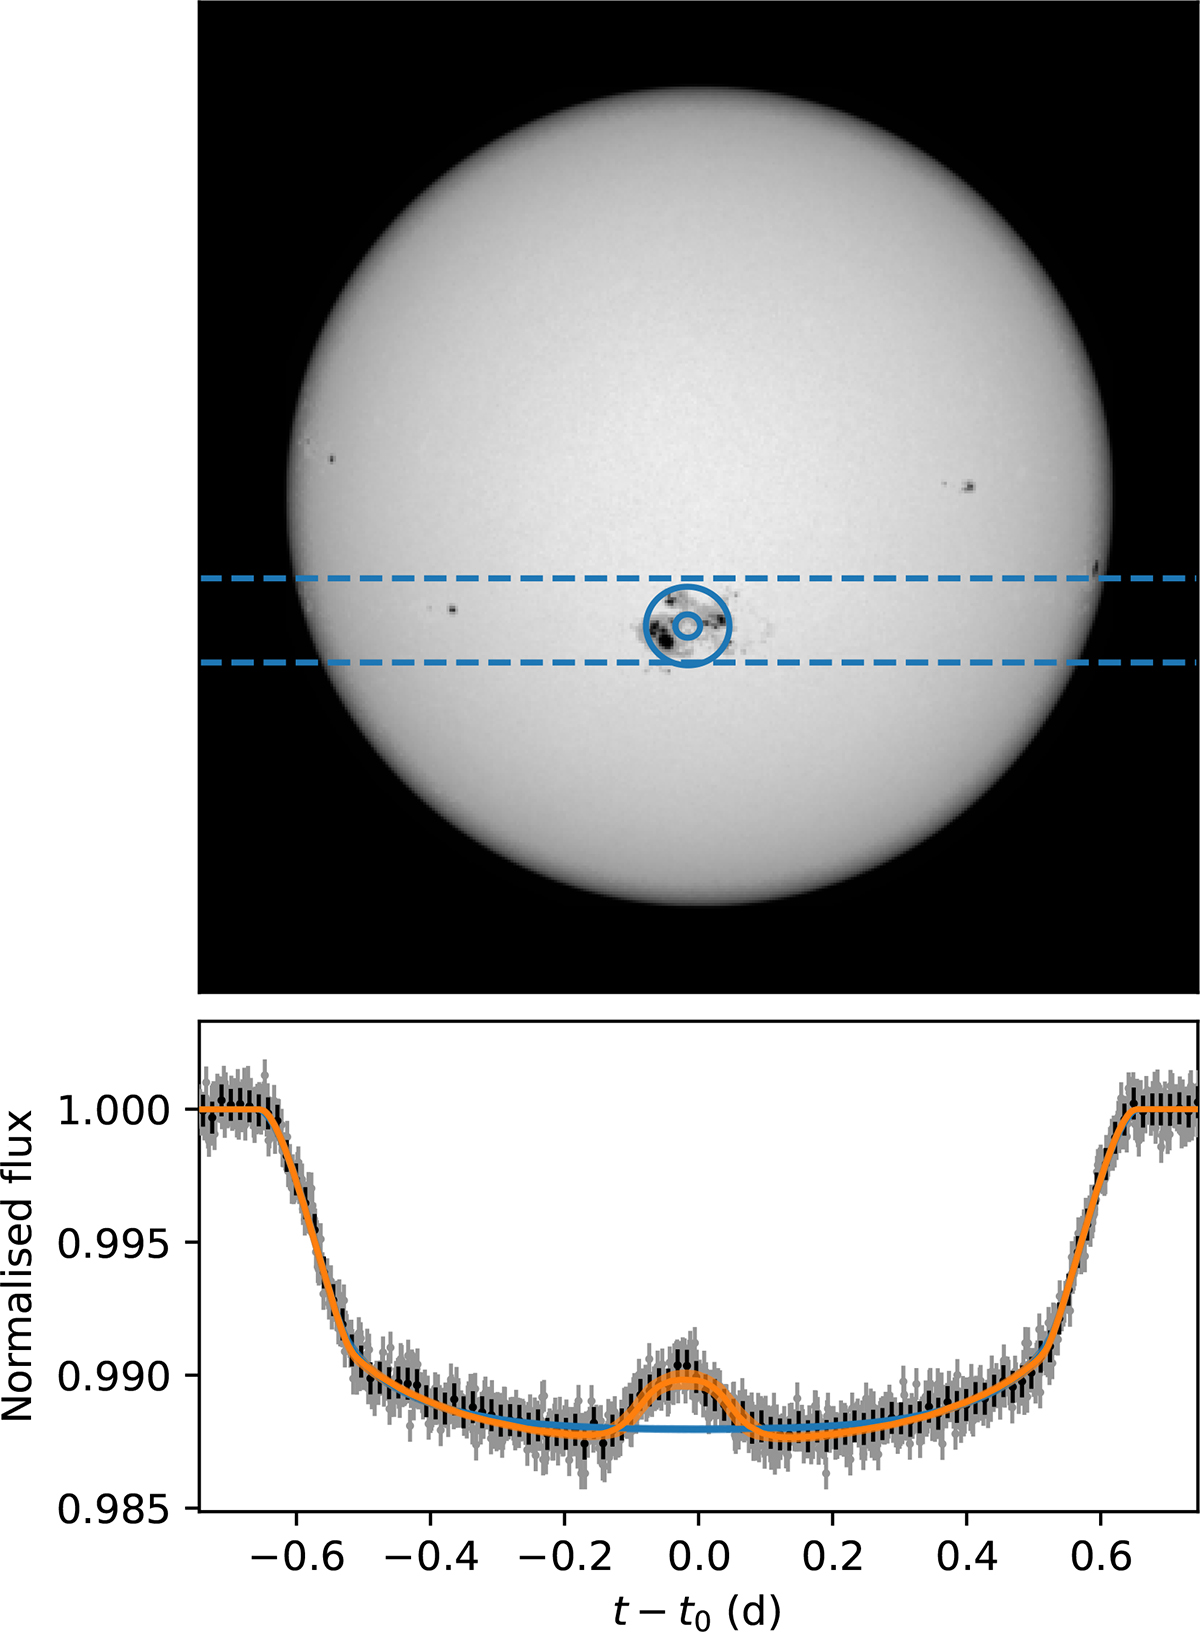
Fig. 1.
Download original image
Top: The Sun during its activity maximum in 2014. The transit path of Jupiter in front of solar latitude −17.5° is marked with dashed lines. The largest sunspot group of the solar cycle, AR2191 is close to the centre of the transit path. The properties of the spot group were reconstructed based on the simulated transit light curve of Jupiter. The inner blue circle indicates the position and size of the dark region, if the beginning and end of the eclipse over the spot group are taken as tin and tout, respectively. The outer circle represents the spot group if the eclipse times are adjusted to tin − σDR and tout + σDR. Below: Simulated transit light curve of Jupiter, in front of −17.5° solar latitude. The light curve has similar noise properties as high precision TESS observations. A model assuming one dark region (orange) and an unspotted photosphere (blue) is shown on top of the light curve.
Current usage metrics show cumulative count of Article Views (full-text article views including HTML views, PDF and ePub downloads, according to the available data) and Abstracts Views on Vision4Press platform.
Data correspond to usage on the plateform after 2015. The current usage metrics is available 48-96 hours after online publication and is updated daily on week days.
Initial download of the metrics may take a while.