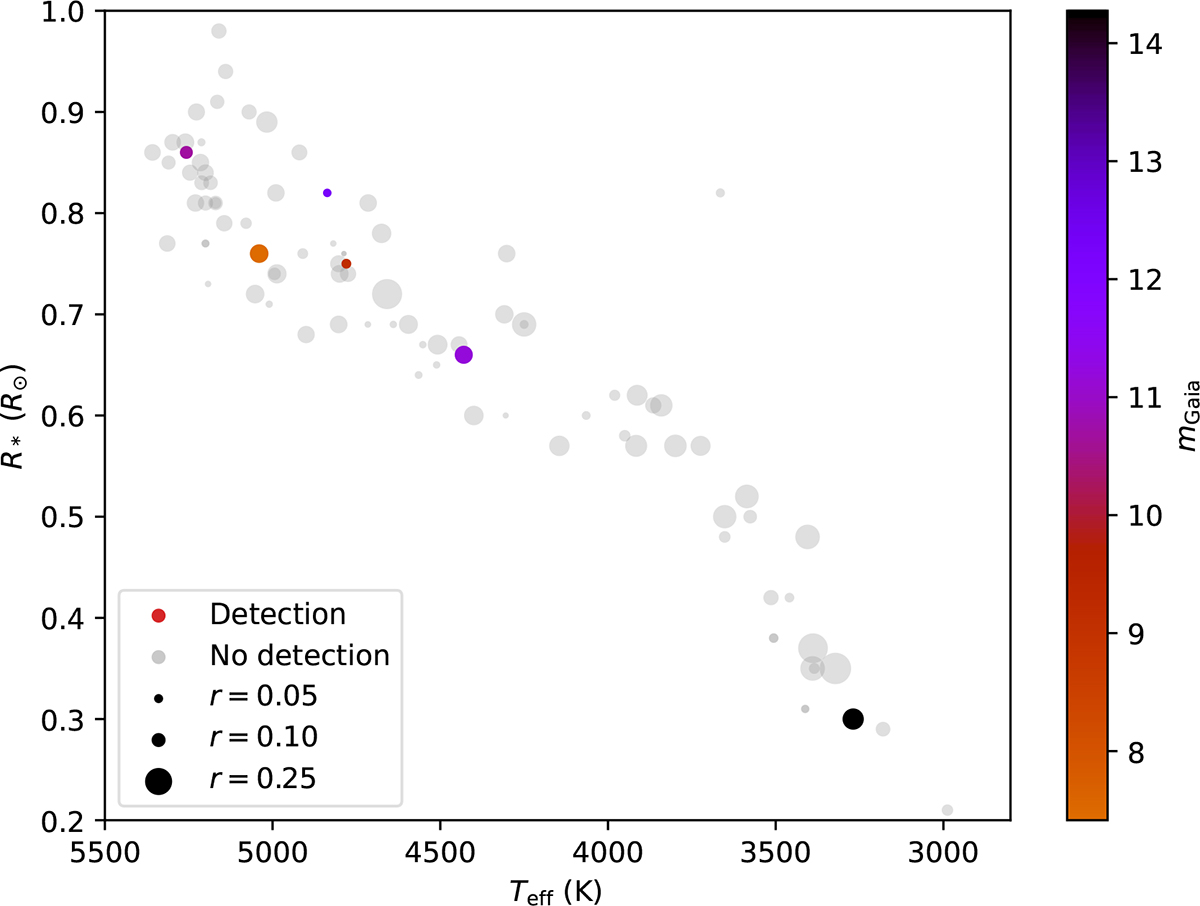
Fig. 3.
Download original image
Distribution of systems with DR eclipse detections (coloured dots) in terms of stellar effective temperature Teff, stellar radius R*, and planet–star radius ratio r, compared to systems where no DR eclipse was found (grey dots). The colour mapping of the systems with DR eclipses corresponds to the Gaia magnitudes mGaia of the stars.
Current usage metrics show cumulative count of Article Views (full-text article views including HTML views, PDF and ePub downloads, according to the available data) and Abstracts Views on Vision4Press platform.
Data correspond to usage on the plateform after 2015. The current usage metrics is available 48-96 hours after online publication and is updated daily on week days.
Initial download of the metrics may take a while.