Fig. 4.
Download original image
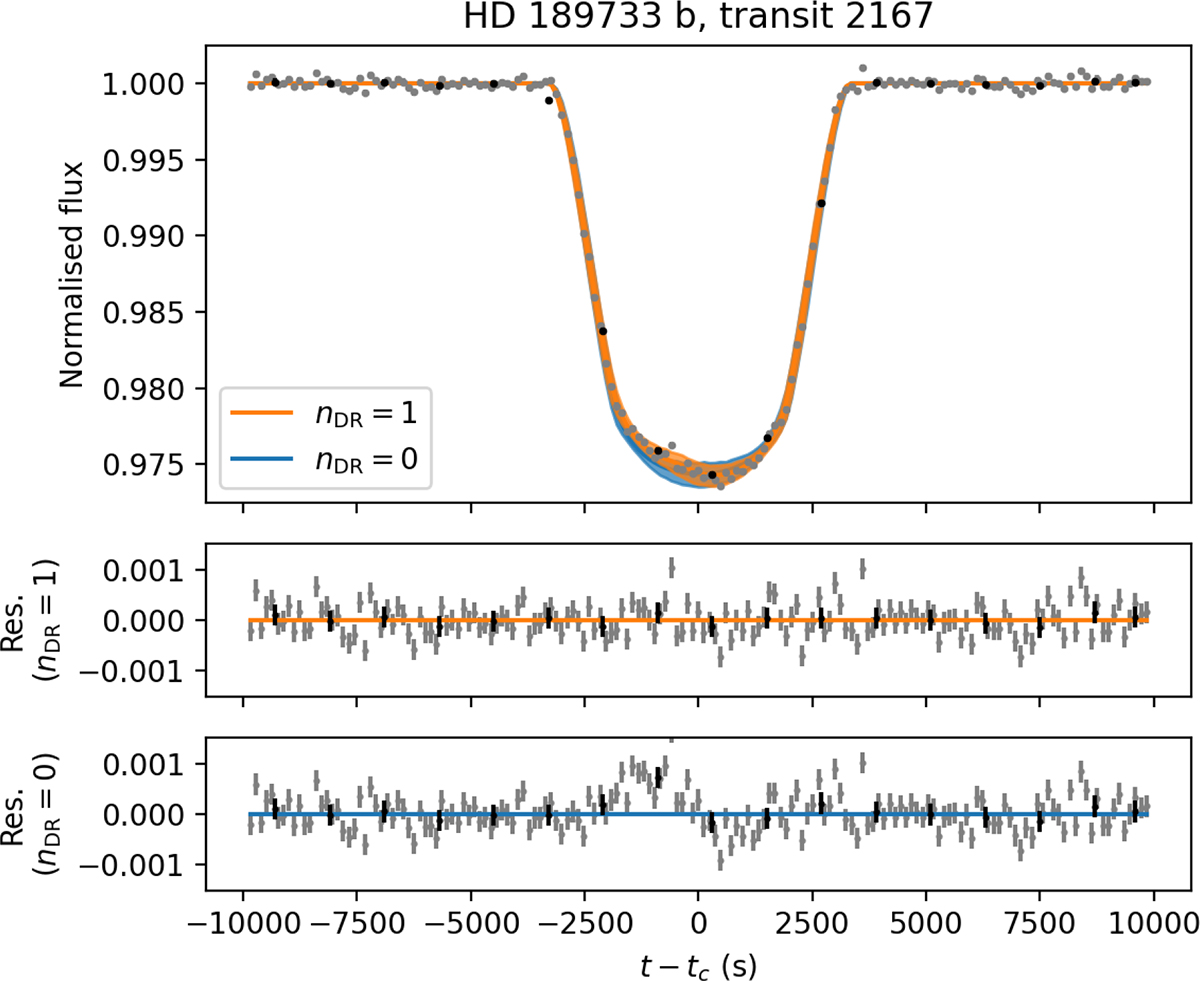
Transit of HD 189733 b observed by TESS with a cadence of 120 s. Black dots represent the mean of consecutive subsets of ten observations. Maximum likelihood fits from the nDR = 1 and nDR = 0 models are marked with orange and blue lines respectively, one sigma uncertainties are marked as shaded areas. The residuals of the highest likelihood nDR = 1 and nDR = 0 model fits are shown in the middle and the bottom of the figure, respectively. The feature between t − tc ≈ −2200 s and t − tc ≈ −300 s is an eclipse of a dark region with a radius of ![]() ° and a contrast of 0.04.
° and a contrast of 0.04.
Current usage metrics show cumulative count of Article Views (full-text article views including HTML views, PDF and ePub downloads, according to the available data) and Abstracts Views on Vision4Press platform.
Data correspond to usage on the plateform after 2015. The current usage metrics is available 48-96 hours after online publication and is updated daily on week days.
Initial download of the metrics may take a while.