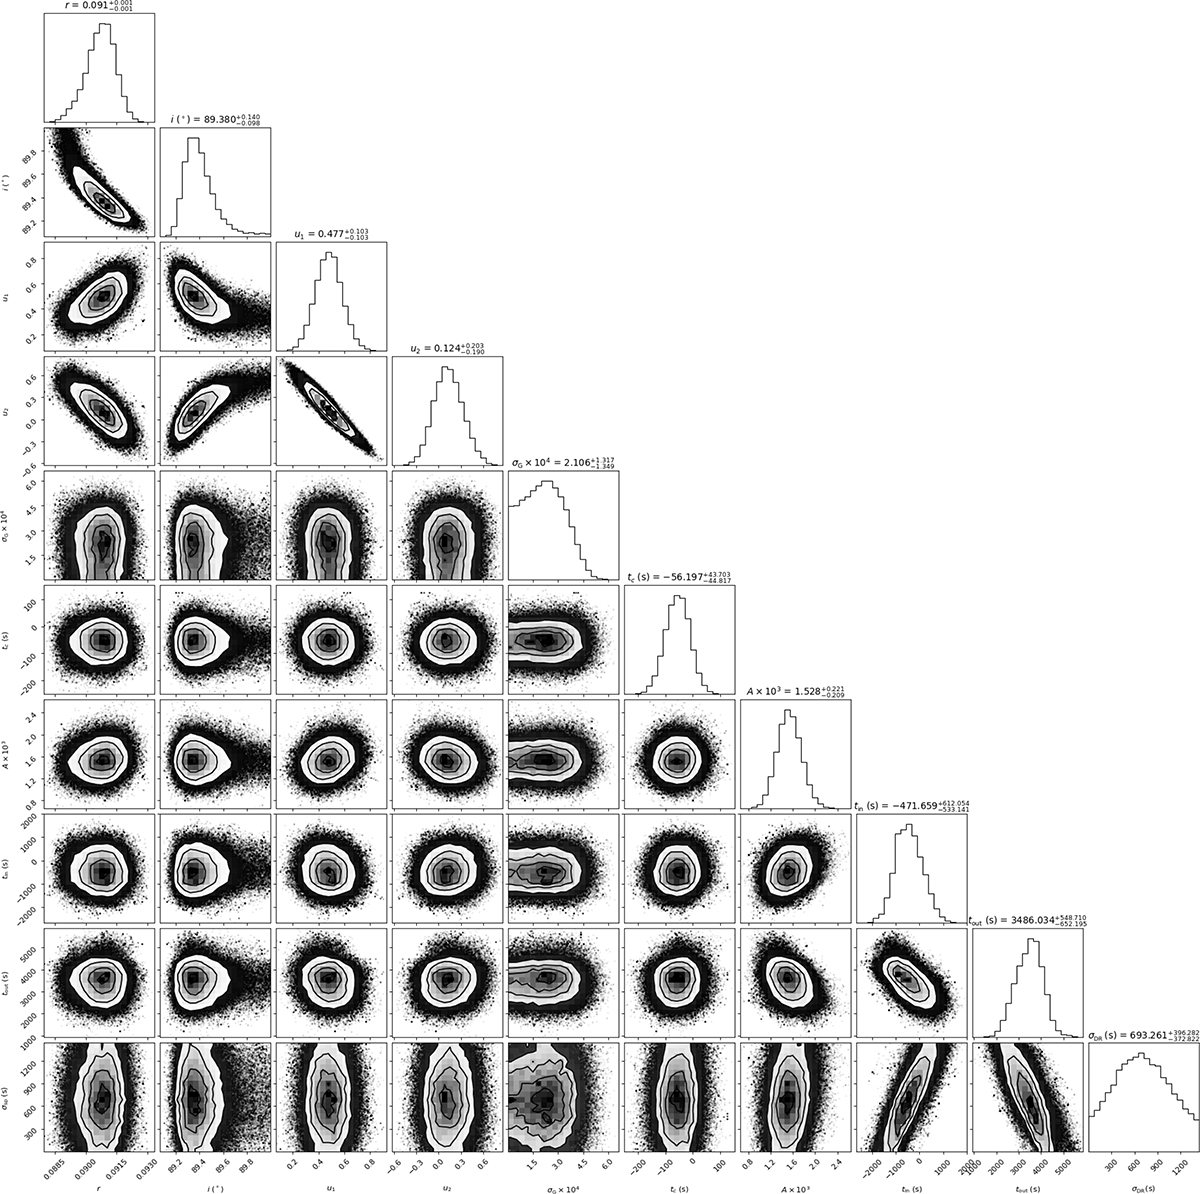
Fig. B.1.
Download original image
Corner plots of modelled parameters obtained from sampling the transit light curves of TOI-1268 b. The first four columns from the left (r, i, u1, u2) are parameters are uniform for the whole modelled segment of transit light curves. The fifth column gives the variance of the excess white noise in the observations. The last five columns (tc, A, tin, tout, σDR) show parameters obtained from sampling transit 3 of the planet, which had decisive evidence for one spot occultation event.
Current usage metrics show cumulative count of Article Views (full-text article views including HTML views, PDF and ePub downloads, according to the available data) and Abstracts Views on Vision4Press platform.
Data correspond to usage on the plateform after 2015. The current usage metrics is available 48-96 hours after online publication and is updated daily on week days.
Initial download of the metrics may take a while.