Fig. 3.
Download original image
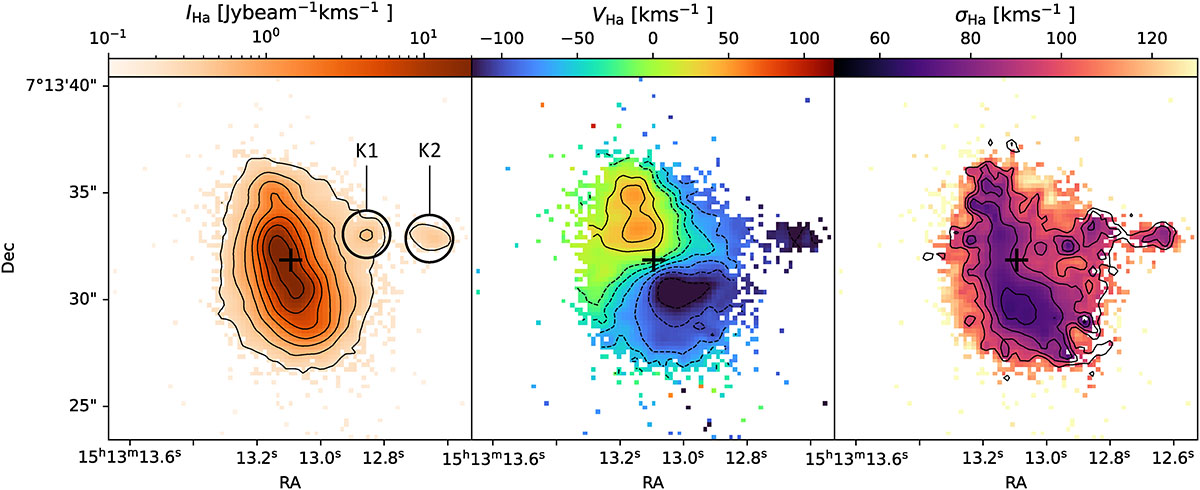
Moment maps showing the integrated intensity (M0; left), the velocity field (M1; centre), and the velocity dispersion (![]() ; right) of the ionised Hα emission. In each case a signal-to-noise cut of three has been applied, and images have been smoothed with a 1σ Gaussian kernel to improve the visual output. The position of the CON, as derived from the ALMA continuum (Lankhaar et al. 2024), is marked with a black cross, and the locations of the two knots in the outflow (K1 and K2) are labelled in the left panel.
; right) of the ionised Hα emission. In each case a signal-to-noise cut of three has been applied, and images have been smoothed with a 1σ Gaussian kernel to improve the visual output. The position of the CON, as derived from the ALMA continuum (Lankhaar et al. 2024), is marked with a black cross, and the locations of the two knots in the outflow (K1 and K2) are labelled in the left panel.
Current usage metrics show cumulative count of Article Views (full-text article views including HTML views, PDF and ePub downloads, according to the available data) and Abstracts Views on Vision4Press platform.
Data correspond to usage on the plateform after 2015. The current usage metrics is available 48-96 hours after online publication and is updated daily on week days.
Initial download of the metrics may take a while.