| Issue |
A&A
Volume 704, December 2025
|
|
|---|---|---|
| Article Number | A195 | |
| Number of page(s) | 9 | |
| Section | Extragalactic astronomy | |
| DOI | https://doi.org/10.1051/0004-6361/202453013 | |
| Published online | 15 December 2025 | |
The detection of a large-scale ionised outflow in the local CON galaxy Zw049.057
1
Department of Space, Earth and Environment, Chalmers University of Technology, Onsala Space Observatory, 439 92 Onsala, Sweden
2
National Radio Astronomy Observatory, Charlottesville, VA 22903, USA
3
Department of Astronomy, University of Florida, Gainesville, FL 32611, USA
4
Department of Astronomy, University of Virginia, Charlottesville, VA 22904, USA
5
The Institut de radioastronomie millimétrique (IRAM), Domaine Universitaire, 38406 Saint Martin d’Hères, France
6
Wisconsin IceCube Particle Astrophysics Center, Madison, WI 53703, USA
7
Center for Interdisciplinary Exploration and Research in Astrophysics (CIERA) and Department of Physics and Astronomy, Northwestern University, Evanston, IL 60208, USA
8
Jodrell Bank Centre for Astrophysics, Department of Physics and Astronomy, The University of Manchester, M13 9PL, UK
9
Department of Astronomy, University of Virginia, 530 McCormick Road, Charlottesville, VA 22903, USA
10
Observatoire de Paris, LERMA, Collège de France, CNRS, PSL University, Sorbonne University, Paris, France
11
National Radio Astronomy Observatory, 520 Edgemont Road, Charlottesville, VA 22903, USA
12
Centro de Astrobiología (CAB), CSIC-INTA, Camino Bajo del Castillo s/n, E-28692 Villanueva de la Cañada, Madrid, Spain
13
Max-Planck-Institut für Radioastronomie, Auf dem Hügel 69, 53121 Bonn, Germany
14
Astronomy Department, Faculty of Science, King Abdulaziz University, P.O. Box 80203 Jeddah 21589, Saudi Arabia
15
National Astronomical Observatory of Japan, National Institutes of Natural Sciences (NINS), 2-21-1 Osawa, Mitaka, Tokyo 181-8588, Japan
16
Steward Observatory, University of Arizona, 933 North Cherry Avenue, Tucson, AZ 85721, USA
17
National Radio Astronomy Observatory, 520 Edgemont Road, Charlottesville, VA 22903-2475, USA
18
Department of Astronomy, The University of Tokyo, 7-3-1, Hongo, Bunkyo, Tokyo 113-0033, Japan
19
Nu cleo de Astronom ía de la Facultad de Ingenier ía, Universidad Diego Portales, Av. Ej ercito Libertador 441, Santiago 22, Chile
20
Kavli Institute for Astronomy and Astrophysics, Peking University, Beijing 100871, People’s Republic of China
21
Department of Physics, University of Oxford, Keble Road, Oxford OX1 3RH, UK
★ Corresponding author: This email address is being protected from spambots. You need JavaScript enabled to view it.
Received:
15
November
2024
Accepted:
5
September
2025
Abstract
Aims. Current co-evolutionary models of galaxies and their supermassive black holes (SMBHs) almost unanimously predict the existence of a heavily dust-obscured nuclear phase, critical in growing the SMBH and providing feedback to the host galaxy. However, this phase is poorly understood. Compact obscured nuclei (CONs) are relatively common in local (ultra-)luminous infrared galaxies and are the most obscured nuclei known to date, offering the opportunity to study the effects of such a dust-obscured phase on the galaxy. This work presents a case study of the local CON Zw049.057; we study the large-scale features of the galaxy and their connection to the ongoing activity of the central CON.
Methods. We present new, targeted MUSE observations of the local CON galaxy Zw049.057, which is known to host multiple outflow features within its central few hundred parsecs. By mapping the kinematics of Hα, we analysed the large-scale features of the galaxy.
Results. For the first time, we identify a kiloparsec-scale ionised outflow in Zw049.057, traced by Hα emission. Kinematics reveal the outflow to be blueshifted and orientated to the foreground of the stellar disk. The ionisation of this outflow is consistent with shock-heating, which may be related to the presence of a previously identified radio jet in the galaxy.
Key words: ISM: jets and outflows / galaxies: active / galaxies: evolution / galaxies: interactions / galaxies: starburst
© The Authors 2025
 Open Access article, published by EDP Sciences, under the terms of the Creative Commons Attribution License (https://creativecommons.org/licenses/by/4.0), which permits unrestricted use, distribution, and reproduction in any medium, provided the original work is properly cited.
This article is published in open access under the Subscribe to Open model. This email address is being protected from spambots. You need JavaScript enabled to view it. to support open access publication.
1. Introduction
Luminous (LIR > 1011 L⊙) and ultra-luminous (LIR > 1012 L⊙) infrared galaxies ((U)LIRGs) dominate the population of galaxies with Lbol > 1011 L⊙ in the local Universe (z ≲ 0.05), outnumbering optically selected starbursts, Seyferts, and quasars (Sanders & Mirabel 1996). As their name suggests, the bulk of the luminosity from (U)LIRGs is radiated at IR wavelengths (8 < λ < 1000 μm). This IR flux is dominated by thermal dust emission caused by the absorption, and subsequent re-radiation, of higher-energy photons produced by heating from young stars and/or an active galactic nucleus (AGN). This process requires heavy dust obscuration towards the nucleus, and indeed, galaxies classified as (U)LIRGs host deeply embedded nuclei. Given that the most active growth phase of galaxies and their supermassive black holes (SMBHs) occurs when the SMBH is heavily obscured by dust, (U)LIRGs are thought to be rapidly evolving systems, with many studies suggesting they are an early, obscured stage of evolution in starburst galaxies and AGNs (e.g. Sanders et al. 1988; Spoon et al. 2006; Aalto 2008; Costagliola et al. 2011).
Between 20 and 40 per cent of nearby (U)LIRGs host compact obscured nuclei (CONs; e.g. Falstad et al. 2021; García-Bernete et al. 2022). These CONs exhibit extreme nuclear column densities (NH2 1025 cm−2, Av ≫ 1000; e.g. Perez-Torres et al. 2021), which cause severe attenuation towards the nucleus, even in the X-ray regime in the most extreme cases. This typically makes CONs challenging to detect. While several detection methods have been proposed, including using mid-IR spectra (Donnan et al. 2023), polyaromatic hydrocarbon ratios (García-Bernete et al. 2022) and water transitions (Yang et al. 2019), the identification of CONs to date has largely relied on the detection of the rare ν2 = 1f transition of vibrationally excited HCN, which traces hot dust at high column densities (Aalto et al. 2015a). All known CONs have been shown to host molecular outflows on scales of ∼100 pc, and most also show evidence of inflows traced by HCN, OH, and/or CO (e.g. Nishimura et al. 2024; González-Alfonso et al. 2017). Outflows and inflows have long been considered key mechanisms by which the SMBH can impact the galaxy beyond its direct sphere of influence (Ferrarese & Merritt 2000; Gebhardt et al. 2000), and thus the prevalence of such features in CONs points to these systems being in a critical phase of a SMBH feedback cycle. Studying CON outflows and the impact they have on their host galaxy therefore provides a unique insight into the most obscured phases of nuclear feedback, which governs the co-evolution of SMBHs and their host galaxies (e.g. Wethers et al. 2024).
Zw049.57 (IRAS15107+0724), hereafter Zw049, is a local LIRG (LIR = 1.8 × 10¹¹ L⊙) located at [RA, Dec] J200 = [15:13:13.10 +07:13:32.0] (Lankhaar et al. 2024). Zw049 is a known CON (Aalto et al. 2015a; Falstad et al. 2021), with prolific outflow and inflow features within its central few hundred parsecs. Previous observations from the Very Large Array (VLA) reveal the presence of a faint 5 GHz radio jet orientated to the north-west of the galaxy nucleus (Falstad et al. 2018). Along the east–west (minor) axis of the galaxy, HCN emission detected by the Atacama Large Millimeter/submillimeter Array (ALMA) traces a collimated molecular outflow (Lankhaar et al. 2024, Wethers et al. in prep.). However, the misalignment of this structure with the radio jet makes it unclear whether these different features are connected to each other and how they influence the galaxy at larger radii. Until now, no ionised counterpart to either of these structures had been observed.
In this paper we present the first results from new integral field unit (IFU) observations with the Multi-Unit Spectroscopic Explorer (MUSE) for the local CON host Zw049. Section 2 details the observations, reduction pipeline, and resulting data products. Section 3 outlines the key results of this work, including the discovery of a kiloparsec-scale ionised outflow along the minor axis. The key properties of this outflow are presented and its potential ionisation mechanism(s) are discussed in Sect. 4. Our key findings are summarised in Sect. 5. Throughout this paper, we assume a flat Λ cold dark matter cosmology with H0 = 70 km s−1 Mpc−1, ΩM = 0.3, and ΩΛ = 0.7. We adopt a redshift of z = 0.01299 (Katgert et al. 1998), which corresponds to a systemic velocity of 3897 kms−1 and a distance of 56 Mpc (266 pc/″; Sanders et al. 2003). To account for the potential offsets in the MUSE astrometry, we performed an astrometric correction by cross-matching a star in the MUSE field of view with the Gaia catalogue to align the MUSE world coordinate system (WCS).
2. Observations
2.1. Data overview
We present new observations of the CON galaxy Zw049, taken with MUSE (Bacon et al. 2010). MUSE is a panoramic IFU spectrograph on the Very Large Telescope (VLT) in Cerro Paranal, Chile. Observations were carried out in July 2021, during the ESO observing period 104, under clear sky conditions with an average seeing of 0.62 arcsec. The total on-source integration time was 1.0 h. Data were taken in the wide field mode, covering a field of view of 60 × 60 arcsec, with a 0.2 × 0.2 arcsec spatial sampling. The theoretical instrument resolution is 0.4 arcsec (full width at half maximum; FWHM) at 7000 Å. The nominal instrument setup provides a spectral coverage from 4750 to 9300 Å at a mean resolution of 2.5 Å (FWHM) and provides a dataset of > 90 000 individual spectra (323 × 324 spaxels). The raw data products were processed with the MUSE ESOREFLEX pipeline (v.2.6.2; Freudling et al. 2013) to produce a fully calibrated and combined science-ready data cube with a point spread function (PSF) FWHM of 0.8 × 1.0 arcsec at 5000 Å. Any residual sky contamination was identified using the Zurich Atmosphere Purge (ZAP) software package (Soto et al. 2016) and removed from the final data cube.
2.2. Continuum subtraction
To isolate the emission features of Zw049, we removed the galaxy continuum using a penalised pixel fitting (pPXF) based on a non-linear least squares fitting routine (Cappellari 2017). This method models the stellar component of the galaxy in each pixel with single stellar population (SSP) synthesis models. Here, we utilised SSP models from v9.1 of the Medium resolution INT Library of Empirical Spectra (MILES; Falcón-Barroso et al. 2011). The complete MILES library consists of spectra for ∼1000 stars obtained with the 2.5m INT telescope. The templates included in the library cover a wavelength range of 3525–7500 Å (Sánchez-Blázquez et al. 2006) at a spectral resolution of 2.5 Å (FWHM), corresponding to the mean instrumental resolution of MUSE. Templates span a large range in atmospheric parameters, with ages ranging from 0.03–17.78 Gyr and metallicities 0.0001 < Z< 0.04. The stellar templates are fitted pixel-wise to the MUSE data cube, following the initial reduction outlined in Sect. 2.1. To ensure the continuum is not overestimated, all known emission features are masked such that the continuum fitting is only dependent on the stellar and absorption features, tracing the interstellar reddening, and the age and metallicity of the stellar population(s). No modelling of the emission features is performed at this stage. The resulting best-fit continuum model for each pixel is subtracted from the original data and the resulting spectra are re-binned to channels of a fixed velocity width, ΔV = 55.9 km s−1, to produce the final, science-ready, continuum-subtracted data cube. Figure 1 demonstrates this process for a single spaxel at the centre of Zw049.
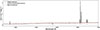 |
Fig. 1. Example pPXF continuum modelling and subtraction for a single spaxel at the CON position. |
3. Results
3.1. Stellar velocities
Figure 2 shows the stellar velocity structure of Zw049, derived from the stellar continuum modelling outlined in Sect. 2.2. We find Zw049 to host a stellar disk aligned along the major axis of the galaxy, with the receding (red) side to the north and the approaching (blue) side to the south. The rotation of this stellar disk is symmetric about the minor axis, with a projected rotational velocity, Vrot, proj, of Vrot, proj = 98 ± 20 kms−1. The smooth rotation profile of the stellar disk in Zw049 appears unperturbed by any major tidal disruption events.
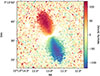 |
Fig. 2. Map of the stellar velocities derived from the pPXF fitting. An initial signal-to-noise ratio cut of three has been applied, with pixels below this threshold omitted. The image has been smoothed with a 1σ Gaussian kernel to improve the visual output. |
3.2. Moment maps
In Fig. 3 we present moment-0 (M0), moment-1 (M1) and moment-2 (M2) maps for the Hα emission in Zw049, denoting the integrated intensity, IHα, the velocity field, VHα, and the velocity dispersion, σHα, respectively. All the moment maps have been created using the scipy package SCIPY.STATS.MOMENT. In each case, a signal-to-noise cut of three has been applied to remove any spurious emission, where the noise level has been estimated to be the measured noise from a nearby blank region of the map.
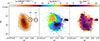 |
Fig. 3. Moment maps showing the integrated intensity (M0; left), the velocity field (M1; centre), and the velocity dispersion ( |

3.2.1. Integrated intensity (M0)
The integrated intensity (M0) map is created by summing the total emission over each of the channels associated with the Hα feature. The Hα emission is strongly concentrated towards the centre of the galaxy, appearing significantly extended along the major axis. This extension is likely an orientation effect caused by the highly inclined disk in Zw049 (Scoville et al. 2000). Morphologically, the central distribution of Hα is clumpy and consists of two seemingly distinct emission peaks separated by ∼0.6 kpc (∼2.0 arcsec), with a potential third, fainter peak located farther to the north. None of these emission peaks, however, correspond spatially to the position of the CON in Zw049. Instead, the CON lies between the two brightest emission peaks in the centre of the galaxy. We propose that the double-peaked Hα emission structure most likely arises from the extreme dust obscuration of the CON region. Indeed, Zw049 is known to have a nuclear column density, NH, of NH ≳ 5 × 1024 cm−2 towards the central ∼50 pc (González-Alfonso et al. 2012; Falstad et al. 2015; Gallagher et al. 2024). While the centres of the two brightest emission peaks are separated by ∼0.6 kpc (∼2.0 arcsec), corresponding to a scale ∼6 times larger than the heavily obscured CON region, the inner edges of the two clumps are separated by < 130 pc, which is broadly consistent with the 100 pc (diameter) CON region. We therefore suggest that the extreme dust attenuation towards the CON is sufficient in explaining the double-peaked Hα structure seen in Zw049.
Nevertheless, we considered the alternate scenario that Zw049 hosts multiple nuclei. Zw049 is a LIRG, and LIRGs, as a population, are strongly associated with merger events and interactions (e.g. Ellison et al. 2013). Indeed, Zw049 is known to have undergone a recent minor merger event. It would therefore be somewhat expected for Zw049 to host multiple nuclei as a result of this interaction, yet there is little evidence to support this hypothesis. In particular, the stellar kinematics of the galaxy (Fig. 2) show a smooth major axis rotation, with no kinematic signatures of a dual nucleus. However, this idea that Zw049 hosts multiple nuclei was also postulated by Gallagher et al. (2024), who identify two dust pillars with seemingly distinct launch sites towards the inner region of the Zw049, potentially associated with separate nuclei. The launch sites of these dust pillars however, do not align with the Hα emission peaks detected with MUSE, as we demonstrate in Sect. 4.3, and Gallagher et al. (2024) themselves suggest that the dust pillars are more likely part of a dusty cone structure. Furthermore, 5 GHz radio observations of this source (Falstad et al. 2018) do not indicate the presence of a second nucleus, although this does not necessarily rule out this scenario. With the spatial resolution of the wide-field MUSE data in this work, we cannot rule out the possibility that Zw049 hosts multiple nuclei, and require kinematic measures of the nuclear region at higher spatial resolution.
In addition to the double-peaked inner structure, we identify extended Hα emission to the west of the nucleus, roughly aligned with the minor axis of the Zw049. This emission extends out to a projected distance, Dproj ∼ 2.0 kpc (∼8.0 arcsec) and consists of two distinct knots, which we call knot 1 (K1) and knot 2 (K2; see Fig. 3). This is the first time this structure has been detected in Zw049, owing to the high sensitivity and wide-field coverage of MUSE. Similar knot structures were identified in another CON galaxy, NGC4418 with MUSE (Wethers et al. 2024), where they were found to be consistent with ionisation from a fading AGN. We note, however, that the knots in NGC4418 were distributed throughout the galaxy and, thus, may trace a different phenomenon from the knots seen here. As we will demonstrate throughout this paper, the extended Hα emission detected here is consistent with the presence of a previously unknown large-scale ionised outflow in Zw049. In the remainder of this paper, we focus on the properties of this outflow, its relation to other features and its potential impact on the host galaxy.
3.2.2. Velocity field (M1)
The velocity field (M1) map measures the offset in the observed velocity of a given emission feature with respect to the systemic velocity of the line. Here, we present the M1 map for the Hα emission in Zw049. The systemic velocity is assumed to be the measured value of the Hα velocity at the position of the CON, which corresponds to a value of cz = 3906 kms−1 ± 28 kms−1, where the uncertainties correspond to the velocity resolution of the MUSE spectra (55.9 kms−1 channel width). The value we measure is consistent with the cz = 3900 ± 20 kms−1 measured for this galaxy in Aalto et al. (2015b) based on the HCN emission observed by the Institut de Radioastronomie Millimétrique (IRAM). The M1 map (Fig. 3) shows a rotation along the major axis of Zw049, with the receding (red) side of the disk to the north, and the approaching (blue) side to the south, consistent with the rotational structure of the stellar disk in Sect. 3.1. We attribute this to the rotation of ionised component of the stellar disk.
In addition to mapping the ionised gas component of the galaxy disk, we identify noticeable non-circular motions in the velocity structure along the minor axis of Zw049, which we attribute to the ionised outflow postulated in Sect. 3.2.1. We measure blueshifted velocities of |Vout, proj | < 125 kms−1, extending to a projected distance, Dproj, of Dproj ∼ 2.0 kpc. This indicates that the outflow is orientated towards the observer and lies in front of the galaxy disk. In Sect. 3.5.1 we examine the velocity structure of this outflow further, correcting for the effects of inclination.
3.2.3. Velocity dispersion (M2)
The M2 map measures the dispersion, or width, of a given emission feature, providing a measure of the spread in velocities traced by the line. This can be converted simply to a measure of the velocity dispersion,  , tracing the energy and turbulent motion of the gas, where higher values of σ typically denote higher turbulence. The resulting σ map is shown in Fig. 3 (right panel), where we detect an increase in the Hα velocity dispersion along the minor axis of Zw049, consistent with the position of the ionised outflow. Along this axis, we measure velocity dispersions of 80 < σ < 90 kms−1, corresponding to an increase in σ of ∼15 kms−1 with respect to the galaxy centre, where we measure values of 65 < σ < 75 kms−1. This depletion in σ in the centre of the galaxy appears C-shaped, and is largely elongated along the major axis of the galaxy. This strongly supports the ionised outflow interpretation, implying higher turbulence in the gas situated in the outflow. Furthermore, the strongest σ increase is measured at the base of the outflow, in the centre of the ‘C’ structure, close to the CON. We therefore infer that the ionised outflow observed in Hα originates from the central region of the galaxy and is likely being driven by turbulence-inducing processes such as star formation or activity from an AGN.
3.3. Dust properties of Zw049
We considered two independent measures of the dust content to map the dust structure of Zw049: the reddening of the best-fit stellar templates and the Balmer decrement.
Stellar template reddening: As part of the pPXF fitting (see Sect. 2.2) a best-fit reddening template is applied to the continuum to provide a proxy for the amount of dust, E(B − V), in each spaxel of the cube, assuming a Calzetti et al. (2000) extinction curve. Based on this, we mapped the dust content of Zw049 (Fig. 4). We find the dust to be concentrated towards the centre of the galaxy, where we observe a similar C-shaped structure to that seen in the σ map of the ionised gas (Fig. 3). From this, we postulate that the dust in the inner part of this C-shaped region, corresponding to the largest σ increases, has likely been ‘blown out’ by the same process that is injecting energy into the outflow and inducing turbulence in the ionised gas. Additionally, the edges of this C shape align with known dust columns in the galaxy (Scoville et al. 2000; Gallagher et al. 2024), observed at optical wavelengths.
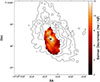 |
Fig. 4. Comparison of the dust structures in Zw049 derived from the best-fit E(B − V) value template for the stellar reddening (contours) and the Balmer decrement (image). Contours levels denote E(B − V) = 0.1, 0.2, 0.3, 0.4, 0.5, and 0.6. The black cross denotes the position of the CON source for reference. A 3σ noise cut has been applied to the Balmer decrement map to include only pixels for which both Hα and Hβ lie above this noise threshold. The map has been smoothed with a 1σ Gaussian kernel to improve the visual output. |
The Balmer decrement: The Balmer decrement compares the observed strength of the narrow component of the Hα and Hβ emission lines, given as the Hα/Hβ ratio. Under standard conditions with no dust obscuration, this ratio is governed by the recombination physics of the Balmer series, giving a value of Hα/Hβ = 2.86 (e.g. Osterbrock & Ferland 2006). However, the presence of dust will preferentially obscure emission at lower wavelengths and result in a lower relative observed strength of Hβ, thus increasing the measured Hα/Hβ ratio. Indeed, we measure an increase in the Hα/Hβ ratio towards the centre of Zw049, elongated along the major axis (Fig. 4) and aligning with the position of double-peaked Hα structure traced by the M0 map (Fig. 3). We note that Hα/Hβ > 2.86 is measured at the locations of the two knots (K1 and K2) in the ionised outflow, but the Hβ emission in this region falls below the 3σ detection threshold. Nevertheless, these measurements, combined with the stellar reddening in the knots of the outflow, imply dust to be present in the knot structures.
Overall, the dust structure derived from the stellar reddening templates and the Balmer decrement are broadly consistent. While the dust in the central region of the galaxy differs, both metrics reproduce an elongated dust structure along the major axis and indicate the presence of dust in the knots of the ionised outflow.
3.4. Channel maps
To better understand the velocity structure of the ionised outflow in Zw049, we plotted channel maps for the Hα emission to separate the emission at different velocities. Figure 5 shows the resulting maps, which have been binned to 55.9 kms−1, corresponding to the velocity widths of the channels in the MUSE spectra. The ionised outflow is clearly detected in both the blue- and redshifted emission at low velocities (|Vout, proj | < 84 kms−1), while at |Vout, proj | > 84 kms−1, only the blueshifted emission traces the outflow. This implies that in addition to moving outwards from the galaxy centre, the outflow is also expanding with a velocity, Vexpand < 84 kms−1. The blueshifted gas in the outflow is detected out to |Vout, proj | < 140 kms−1, corresponding to a maximum outflow velocity of |Vout| = 344 kms−1, assuming an inclination of i = 66°. This value is consistent with that estimated from the M1 map of Hα (Sect. 3.2.2).
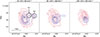 |
Fig. 5. Channel maps for the blue (solid blue contours) and red (dashed red contours) line wings of the Hα emission in Zw049. Each panel denotes one spectral channel, offset from the central line position by one, two, and three channels (left to right), with the corresponding velocity given above. The black cross marks the position of the CON source in each image. |
We note that the potential blending effects between [NII] and Hα are negligible in this analysis. In the channel maps, we considered only ±3 channels from the systemic velocity of Hα. The velocities associated with these channels are too low to have any significant contamination from [NII], as they would correspond to [NII] velocities > 500 kms−1 (projected). This is inconsistent with the moderate velocities measured for the ionised outflow from Hα (|Vout, proj | < 125 kms−1). Even if an [NII] contribution is assumed at these velocities, this would trace the extreme tails of [NII] where the emission is faint. Any contribution from this emission in a given channel would therefore be negligible compared to the that of Hα. Additionally, the kinematics of [NII] and Hα trace different spatial regions of the galaxy. While blueshifted emission traces the outflow and the southern part of the disk, the redshifted emission traces the northern part of the disk. It is therefore unlikely that redshifted emission from [NII] is detected in the blueshifted outflow structure.
3.5. Properties of the ionised outflow
3.5.1. Outflow velocity
In Sect. 3.2 we identify a blueshifted structure along the western side of the minor axis of Zw049, which we attribute to a kiloparsec-scale ionised outflow that appears to be expanding (Sect. 3.4). To calculate the outflow velocity, we measured the shift in the Hα emission line from its systemic velocity. We measure a projected outflow velocity, |Vout, proj|, of 67.15 and 101.91 kms−1 for K1 and K2, respectively. To calculate the de-projected velocity of this feature, we first estimated the inclination angle, i, of the galaxy by fitting an ellipse to the continuum emission at 5800Å and measuring the ratio between the semi-major, a, and semi-minor, b, axes. The inclination angle was then calculated as i = cos−1(a/b). From this, we derive an inclination angle of i = 66 °. This inclination lies within the range of values previously estimated for this galaxy in the literature, which range from i = 40 ° (e.g. Falstad et al. 2018) to i > 70 ° (e.g. Gallagher et al. 2024). We adopted an inclination angle of i = 66 ° rather than the values derived in other works, as measurements based on observations at different wavelengths trace disks at different spatial scales in the galaxy and, thus, may be inclined differently. Indeed, there is emerging evidence to suggest that the stellar disk is significantly more inclined than the nuclear disk in Zw049 (Wethers et al. in prep). Assuming an inclination angle of i = 66 °, we derived de-projected outflow velocities, Vout, of |Vout | = 165.10 and 250.56 kms−1 for K1 and K2, respectively, assuming the outflow is oriented perpendicular to the plane of the galaxy.
3.5.2. Outflow mass
To estimate the mass of the large-scale ionised outflow in Zw049, Mout, we utilised the relation (e.g. Baron et al. 2017; Fiore et al. 2017; Baron & Netzer 2019)
 (1)
(1)
where μ is the mass per hydrogen atom, mH is the hydrogen mass, γ denotes the effective line emissivity, which in the case of Hα is set to 3 × 10⁻²⁵ erg cm3s−1, and LHα, corr is the luminosity of the Hα emission corrected for dust extinction (see Sect. 3.3). The electron density, ne, is estimated from the ratio of the narrow component on the [SII] λ6717 and [SII] λ6731 lines following the methods of McLeod et al. (2015), where
![Mathematical equation: $$ \begin{aligned} {{R}}_{[\mathrm{{SII}}]} = \frac{[\mathrm{{SII}}]_{\lambda 6717}}{[\mathrm{{SII}}]_{\lambda 6731}} \end{aligned} $$](/articles/aa/full_html/2025/12/aa53013-24/aa53013-24-eq4.gif) (2)
(2)
gives the ratio of the sulphur lines, R[SII]. We derive ![Mathematical equation: $ R_\mathrm{{[SII]}} = 1.36^{+0.34}_{-0.27} $](/articles/aa/full_html/2025/12/aa53013-24/aa53013-24-eq5.gif) and 1.41
and 1.41 for K1 and K2, respectively. The resulting values of ne are calculated using the analytical solution for a three-level atom (McCall 1984) as follows:
![Mathematical equation: $$ \begin{aligned} {n_{\rm e}} = \frac{R_{[\mathrm{{SII}}]} - 1.49}{5.6713 - 12.8\,R_{[\mathrm {SII}]} \times {T_{\rm e}}}, \end{aligned} $$](/articles/aa/full_html/2025/12/aa53013-24/aa53013-24-eq7.gif) (3)
(3)
where we have assumed an effective temperature, of Te = 104 K.
For K1 and K2, we derive ne = 108.82 and ne = 66.39
 cm−3, respectively. The derived values of ne for both K1 and K2 are consistent with those expected in extended ionised outflows (ne ∼ 102–103; e.g. Kakkad et al. 2018), when accounting for the large uncertainties. To estimate the mass of the outflow, Mout, tot, we used the Hα emission as a tracer of the dense gas. The Hα emission in the ionised outflow is dominated by the two knots, K1 and K2, with very little diffuse emission, and is physically separated from the position of the stellar disk (Fig. 2). We therefore took the total mass of these two knots as a proxy for the total outflow mass. In this way, we avoided contamination from the stellar disk, which dominates the Hα emission in the galaxy and would result in a significant overestimation of the outflow gas mass. For K1 and K2, we derive Mout, K1 = 1.52 × 10⁵ M⊙ and Mout, K2 = 1.90 × 10⁵ M⊙, respectively, for a total outflow gas mass of Mout, tot = 3.42 × 10⁵ M⊙. We note that the large uncertainties in the values of ne would result in a factor of ∼5 uncertainty in Mout, tot.
3.5.3. Outflow timescales
The projected distances from the CON position in Zw049 to clumps K1 and K2 are measured to be Dproj, K1 = 1.26 kpc and Dproj, K2 = 2.00 kpc, respectively. Correcting for the inclination of the galaxy disk (i = 66°) gives de-projected distances of DK1 = 3.10 kpc and DK2 = 4.92 kpc. Assuming a constant outflow velocity of |Vout| = 165.10 and 250.56 kms−1 for K1 an K2, respectively (see Sect. 3.5.1), we estimate the ages of the two knots in the outflow to be 7.47 Myr (K1) and 7.81 Myr (K2). Assuming a constant outflow rate of 250.56 kms−1, and an outflow timescale of 7.81 Myr, we derive a mass outflow rate, Ṁ = 0.04 M⊙ yr−1. This corresponds to a momentum power Ṗ = Ṁv = 11.02 M⊙ km s−1 yr−1.
4. Discussion
4.1. Ionisation mechanism of the outflow
We considered three possible ionisation mechanisms for the knots in the outflow of Zw049: star formation, AGN photoionisation, and shock heating. To distinguish between these scenarios, we made use of a range of emission line diagnostics, from which we conclude that both star-formation- and AGN-dominated ionisation are unlikely. Instead, we find the outflow in Zw049 to be consistent with having been ionised by low-velocity shocks. We postulate that these shocks may originate from the radio jet, and indeed, the location of K1 is coincident with the lower side of the radio feature observed in (Falstad et al. 2015), but this cannot be confirmed. In this section we outline the diagnostics that led to this conclusion.
4.1.1. BPT diagram
Spectra are extracted from each of the knots, K1 and K2, in the ionised outflow (Fig. 6). For each knot, the spectrum is integrated within a circular aperture, centred on the brightest pixel, with an aperture radius equal to the half-light radius of the knot. The Hβ (λ4861), [O III] (λ5007), Hα (λ6563) and [N II] (λ6583) emission features in the resulting spectra are modelled with a two-component Gaussian, consisting of a broad and narrow emission component. In this way, we isolated the narrow component of the emission tracing the steady state ionisation of gas in the interstellar medium (ISM). The total flux, S, for the narrow component of each emission feature was calculated by integrating over the best-fit Gaussian model. Line ratios were taken from the resulting fluxes and used to place the two knots on a Baldwin, Phillips, and Terlevich (BPT) diagram: a diagnostic diagram designed to distinguish ionisation from star formation from that produced by AGNs (Fig. 7). Both knots are found to lie in an intermediate region of the BPT diagram, between the diagnostic lines of Kauffmann et al. (2003) and Kewley et al. (2001), consistent with both star formation and AGN photoionisation. Both knots are also consistent with having been ionised via shock heating, as indicated by the pink polygon (Alatalo et al. 2016) in Fig. 7.
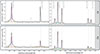 |
Fig. 6. Integrated spectra for K1 (upper) and K2 (lower), extracted from the continuum-subtracted cube. Key emission features are labelled. The Hβ, [OIII], Hα, and [NII] emission features are modelled with a two-component Gaussian, consisting of a broad (blue) and narrow (pink) component. The black line shows the total best-fit model. |
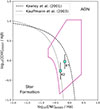 |
Fig. 7. BPT diagram showing the dominant ionising source of K1 and K2, based on the diagnostic models of Kauffmann et al. (2003, dotted) and Kewley et al. (2001, dashed). The region of the diagram consistent with shock heating (Alatalo et al. 2016) is overlaid (pink). |
4.1.2. Lack of broad [O III] emission
Figure 6 shows a lack of broad [O III] emission in K1 and a faint broad component, within the spectral noise, in K2. Unlike the Hα and Hβ emission lines, which both show clear broad emission components in the knots, we find little evidence for broad line emission in [O III]. This indicates that the knots are likely in a low-ionisation state, typically a result of star formation, shock heating, or a combination of shock heating and AGN photoionisation. Based on the lack of broad [O III] emission, we conclude that AGN heating is unlikely to be the dominant ionisation mechanism.
4.1.3. Balmer broadening
The conclusion that AGN heating is not the dominant ionisation mechanism for the outflow is further supported by the lack of broad Hα and Hβ emission in the galaxy centre (Fig. 8). If the knots were ionised by an AGN, we would expect to observe broad emission in the galaxy centre tracing the broad line region (BLR) of the AGN. Instead, we find no significant broad emission towards the centre of the galaxy. This suggests that the Balmer broadening is being driven by outflow kinematics and/or shock broadening, rather than from an AGN BLR, thus further disfavouring an AGN ionisation scenario. While we acknowledge that the extreme dust obscuration of the CON region could prevent the detection of the BLR, the combination of this narrow emission and the lack of broad [O III] features nevertheless indicates that AGN-dominant ionisation is unlikely.
 |
Fig. 8. Spectrum taken from a single pixel at the position of the CON. Key emission features are labelled. The Hβ, [OIII], Hα, and [NII] emission features are modelled with a two-component Gaussian, consisting of a broad (blue) and a narrow (pink) component. The black line shows the total best-fit model. |
4.1.4. [S II]/Hα line ratio
[S II]/Hα is a key diagnostic line ratio used to distinguish between ionisation mechanisms. To measure this ratio, we obtained the total flux of the [S II] doublet(λ6716,6731Å) and compared it to the total Hα flux. From this, we derive [S II]/Hα = 0.41 and 0.27 for K1 and K2, respectively. While the [S II]/Hα of K1 is consistent with the upper end of that expected from star formation (typically [S II]/Hα < 0.3), the moderate ratio of K2 rules out this as a dominant mechanism for the outflow as a whole. Similarly, we rule out ionisation from high-energy shocks, as these typically produce [S II]/Hα > 0.6. Instead, the moderate [S II]/Hα ratios are consistent with transitional or low-ionisation shock-dominated regions. Based on the [S II]/Hα ratios of the knots, particularly of K1, we therefore suggest that the outflow in Zw049 is either ionised by low-velocity shocks or a combination of AGN and shock heating. We note that the presence of low-velocity shocks is further supported by the increased velocity dispersion observed along the outflow (Sect. 3.2.3; Fig. 3). Shocks inject turbulent energy into the ISM, causing an increase in the velocity dispersion, σ, which we observe in this work.
4.1.5. Lack of a stellar continuum
Finally, because of the moderate to low [S II]/Hα ratios (Sect. 4.1.4) and the transitional position of the knots on the BPT diagram (Fig. 7), we explored the possibility that the ionisation arises from star formation. We quickly ruled out this possibility however, due to the lack of stellar continuum emission in the outflow, which would be present if the knots were actively star forming. We therefore conclude that a star-formation-dominated ionisation of the outflow is unlikely and instead favour ionisation via low-velocity shocks.
4.2. Comparison of the outflow and escape velocities
In Sect. 3.5.1 we estimate the velocity of the ionised outflow in Zw049 to be Vout = 302 ± 69 kms−1. Here, we compare this outflow velocity to the escape velocity, Vesc, of the galaxy. Based on the work of Martin (2005), we calculate a Vesc of  Vcirc, where Vcirc is the circular velocity of the stellar disk rotation (Fig. 2). In Sect. 3.1 we measure a value of Vcirc, proj = 98 ± 20 kms−1, which corresponds to a de-projected velocity of Vcirc = 107 ± 22 kms−1, assuming a disk inclination of i = 66 °(Vcirc = Vcirc, proj/sin(i)). Based on these assumptions, we derive a lower limit on the escape velocity for Zw049 of Vesc = 151± 31 kms−1. However, if we instead assume Vesc = 3 × Vcirc (Martin 2005), this increases to Vesc = 321± 66 kms−1, which is much closer to the typical escape velocities observed in LIRGs (∼400 kms−1; Martin 2005). The velocity of K1 in the ionised outflow lies below this range in escape velocities (120 < Vesc < 387 kms−1), while the measured velocity of K2 lies within this range. While it is therefore possible that some of the gas in K2 will eventually escape the galaxy, a large fraction of the gas in the outflow will likely infall back onto the plane of the galaxy. Although we see no evidence of infalling material in the MUSE observations, we highlight that Vesc is defined to be the velocity required to escape an isothermal halo extending to 100 kpc, which is a factor of > 10 larger than the MUSE field of view. As such, the material that will eventually infall back onto the galaxy will do so on timescales exceeding that of the outflow (see Sect. 3.5.3), which could explain why we do not observe it in the MUSE observations.
4.3. Comparison to optical imaging from HST
Recent f555w and f814w imaging from the Hubble Space Telescope (HST) show the presence of two large-scale dust pillars extending in a V shape from the centre of the galaxy (Fig. 9; Gallagher et al. 2024). This ‘V’ structure aligns with the ‘C’ structure we identified in both the velocity dispersion (Sect. 3.2.3) and dust maps (Sect. 3.3) of Zw049. The northern edge of the dusty ‘V’ structure additionally aligns with the faint radio jet identified in Falstad et al. (2018), denoted with an arrow in Fig. 9. Furthermore, the ionised knots of the outflow, traced by the Hα emission from MUSE (contours in Fig 9), are found to align with the centre of the ‘V’ structure formed by the two dust pillars. It is therefore possible that the dusty pillars trace the edges of a cone structure. In this geometry, we suggest that the ionised knots lie within this cone, having likely been shock heated, potentially by the radio jet.
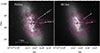 |
Fig. 9. HST imaging showing the V-shaped dust columns in the f555w (left) and f814w (right) bands. Contours showing the integrated intensity of Hα are overlaid. The position of the CON in each image is shown by a black cross. The direction and extent of the faint radio jet detected in Falstad et al. (2018) is illustrated with the white arrow. The two dust pillars are labelled. |
5. Conclusions
We present the discovery of a kiloparsec-scale ionised outflow in the local CON galaxy Zw049, using new targeted observations from MUSE. Based on our analysis, we conclude the following;
-
The ionised outflow extends to 4.92 kpc from the position of the CON along the minor axis of Zw049.
-
The outflow is blueshifted, has a velocity of |Vout| = 250.56 kms−1, and is oriented in front of the galaxy disk towards the line of sight of the observer. The velocities measured for the bulk of the gas in the outflow are sufficiently low to prevent the gas from escaping the galaxy (Vout < Vesc), meaning it will eventually fall back onto the plane of the galaxy.
-
The distribution of gas in the outflow is clumpy and is dominated by two distinct knots. The masses of these knots are 1.52 × 10⁵ M⊙ (K1) and 1.90 × 10⁵ M⊙ (K2), for an estimated total outflow mass of 3.42 × 10⁵ M⊙.
-
The ages of the two knots are calculated to be 7.47 Myr (K1) and 7.81 Myr (K2).
-
The ionisation mechanism of the gas in the outflow is consistent with shock heating, potentially from the radio jet in this system.
-
The outflow appears to be expanding as it moves farther from the centre of the galaxy and aligns with the dust lanes observed in this galaxy with HST. The ionised outflow is therefore consistent with an expanding dust-cone structure.
Acknowledgments
C.W. and S.K. gratefully acknowledge support from a European Research Council (ERC) Advanced Grant, 789410. Y.N. acknowledges support from JSPS KAKENHI Grant Numbers JP23K13140 and JP23K20035. C.R. acknowledges support from Fondecyt Regular grant 1230345, ANID BASAL project FB210003, and the China-Chile joint research fund. I.G.B. is supported by the Programa Atracción de Talento Investigador “César Nombela” via grant 2023-T1/TEC-29030 funded by the Community of Madrid. J.G. thanks the University of Wisconsin Foundation for support of studies of CONs using observations obtained with ground-based telescopes.
References
- Aalto, S. 2008, Astrophys. Space Sci., 313, 273 [Google Scholar]
- Aalto, S., Garcia-Burillo, S., Muller, S., et al. 2015a, A&A, 574, A85 [NASA ADS] [CrossRef] [EDP Sciences] [Google Scholar]
- Aalto, S., Martín, S., Costagliola, F., et al. 2015b, A&A, 584, A42 [NASA ADS] [CrossRef] [EDP Sciences] [Google Scholar]
- Alatalo, K., Cales, S. L., Rich, J. A., et al. 2016, ApJS, 224, 38 [NASA ADS] [CrossRef] [Google Scholar]
- Bacon, R., Accardo, M., Adjali, L., et al. 2010, in Ground-based and Airborne Instrumentation for Astronomy III (SPIE), 7735, 131 [Google Scholar]
- Baron, D., & Netzer, H. 2019, MNRAS, 486, 4290 [Google Scholar]
- Baron, D., Netzer, H., Poznanski, D., Prochaska, J. X., & Förster Schreiber, N. M. 2017, MNRAS, 470, 1687 [CrossRef] [Google Scholar]
- Calzetti, D., Armus, L., Bohlin, R. C., et al. 2000, ApJ, 533, 682 [NASA ADS] [CrossRef] [Google Scholar]
- Cappellari, M. 2017, MNRAS, 466, 798 [Google Scholar]
- Costagliola, F., Aalto, S., Rodriguez, M., et al. 2011, A&A, 528, A30 [NASA ADS] [CrossRef] [EDP Sciences] [Google Scholar]
- Donnan, F., Rigopoulou, D., García-Bernete, I., et al. 2023, A&A, 669, A87 [NASA ADS] [CrossRef] [EDP Sciences] [Google Scholar]
- Ellison, S. L., Mendel, J. T., Scudder, J. M., Patton, D. R., & Palmer, M. J. 2013, MNRAS, 430, 3128 [NASA ADS] [CrossRef] [Google Scholar]
- Falcón-Barroso, J., Sánchez-Blázquez, P., Vazdekis, A., et al. 2011, A&A, 532, A95 [Google Scholar]
- Falstad, N., González-Alfonso, E., Aalto, S., et al. 2015, A&A, 580, A52 [NASA ADS] [CrossRef] [EDP Sciences] [Google Scholar]
- Falstad, N., Aalto, S., Mangum, J., et al. 2018, A&A, 609, A75 [NASA ADS] [CrossRef] [EDP Sciences] [Google Scholar]
- Falstad, N., Aalto, S., König, S., et al. 2021, A&A, 649, A105 [NASA ADS] [CrossRef] [EDP Sciences] [Google Scholar]
- Ferrarese, L., & Merritt, D. 2000, ApJ, 539, L9 [Google Scholar]
- Fiore, F., Feruglio, C., Shankar, F., et al. 2017, A&A, 601, A143 [NASA ADS] [CrossRef] [EDP Sciences] [Google Scholar]
- Freudling, W., Romaniello, M., Bramich, D. M., et al. 2013, A&A, 559, A96 [NASA ADS] [CrossRef] [EDP Sciences] [Google Scholar]
- Gallagher, J., Kotulla, R., Laufman, L., et al. 2024, arXiv e-prints [arXiv:2406.12126] [Google Scholar]
- García-Bernete, I., Rigopoulou, D., Aalto, S., et al. 2022, A&A, 663, A46 [NASA ADS] [CrossRef] [EDP Sciences] [Google Scholar]
- Gebhardt, K., Bender, R., Bower, G., et al. 2000, ApJ, 539, L13 [Google Scholar]
- González-Alfonso, E., Fischer, J., Graciá-Carpio, J., et al. 2012, A&A, 541, A4 [NASA ADS] [CrossRef] [EDP Sciences] [Google Scholar]
- González-Alfonso, E., Armus, L., Carrera, F. J., et al. 2017, PASA, 34 [Google Scholar]
- Kakkad, D., Groves, B., Dopita, M., et al. 2018, A&A, 618, A6 [NASA ADS] [CrossRef] [EDP Sciences] [Google Scholar]
- Katgert, P., Mazure, A., Den Hartog, R., et al. 1998, A&AS, 129, 399 [NASA ADS] [CrossRef] [EDP Sciences] [Google Scholar]
- Kauffmann, G., Heckman, T. M., Tremonti, C., et al. 2003, MNRAS, 346, 1055 [Google Scholar]
- Kewley, L., Heisler, C., Dopita, M., & Lumsden, S. 2001, ApJS, 132, 37 [NASA ADS] [CrossRef] [Google Scholar]
- Lankhaar, B., Aalto, S., Wethers, C., et al. 2024, A&A, 689, A163 [NASA ADS] [CrossRef] [EDP Sciences] [Google Scholar]
- Martin, C. L. 2005, ApJ, 621, 227 [NASA ADS] [CrossRef] [Google Scholar]
- McCall, M. L. 1984, MNRAS, 208, 253 [NASA ADS] [CrossRef] [Google Scholar]
- McLeod, A., Dale, J., Ginsburg, A., et al. 2015, MNRAS, 450, 1057 [NASA ADS] [CrossRef] [Google Scholar]
- Nishimura, Y., Aalto, S., Gorski, M., et al. 2024, A&A, 686, A48 [NASA ADS] [CrossRef] [EDP Sciences] [Google Scholar]
- Osterbrock, D. E., & Ferland, G. J. 2006, Astrophysics Of Gas Nebulae and Active Galactic Nuclei (University science books) [Google Scholar]
- Perez-Torres, M., Mattila, S., Alonso-Herrero, A., Aalto, S., & Efstathiou, A. 2021, A&A Rev., 29, 1 [NASA ADS] [CrossRef] [Google Scholar]
- Sánchez-Blázquez, P., Peletier, R., Jiménez-Vicente, J., et al. 2006, MNRAS, 371, 703 [CrossRef] [Google Scholar]
- Sanders, D., & Mirabel, I. 1996, ARA&A, 34, 749 [NASA ADS] [CrossRef] [Google Scholar]
- Sanders, D., Soifer, B., Elias, J., Neugebauer, G., & Matthews, K. 1988, ApJ, 328, L35 [NASA ADS] [CrossRef] [Google Scholar]
- Sanders, D., Mazzarella, J., Kim, D.-C., Surace, J., & Soifer, B. 2003, ApJ, 126, 1607 [Google Scholar]
- Scoville, N., Evans, A., Thompson, R., et al. 2000, ApJ, 119, 991 [Google Scholar]
- Soto, K. T., Lilly, S. J., Bacon, R., Richard, J., & Conseil, S. 2016, MNRAS, 458, 3210 [Google Scholar]
- Spoon, H. W., Marshall, J., Houck, J., et al. 2006, ApJ, 654, L49 [Google Scholar]
- Wethers, C., Aalto, S., Privon, G., et al. 2024, A&A, 683, A27 [NASA ADS] [CrossRef] [EDP Sciences] [Google Scholar]
- Yang, C., Gavazzi, R., Beelen, A., et al. 2019, A&A, 624, A138 [NASA ADS] [CrossRef] [EDP Sciences] [Google Scholar]
All Figures
|
Fig. 1. Example pPXF continuum modelling and subtraction for a single spaxel at the CON position. |
| In the text | |
|
Fig. 2. Map of the stellar velocities derived from the pPXF fitting. An initial signal-to-noise ratio cut of three has been applied, with pixels below this threshold omitted. The image has been smoothed with a 1σ Gaussian kernel to improve the visual output. |
| In the text | |
|
Fig. 3. Moment maps showing the integrated intensity (M0; left), the velocity field (M1; centre), and the velocity dispersion ( |
| In the text | |
|
Fig. 4. Comparison of the dust structures in Zw049 derived from the best-fit E(B − V) value template for the stellar reddening (contours) and the Balmer decrement (image). Contours levels denote E(B − V) = 0.1, 0.2, 0.3, 0.4, 0.5, and 0.6. The black cross denotes the position of the CON source for reference. A 3σ noise cut has been applied to the Balmer decrement map to include only pixels for which both Hα and Hβ lie above this noise threshold. The map has been smoothed with a 1σ Gaussian kernel to improve the visual output. |
| In the text | |
|
Fig. 5. Channel maps for the blue (solid blue contours) and red (dashed red contours) line wings of the Hα emission in Zw049. Each panel denotes one spectral channel, offset from the central line position by one, two, and three channels (left to right), with the corresponding velocity given above. The black cross marks the position of the CON source in each image. |
| In the text | |
|
Fig. 6. Integrated spectra for K1 (upper) and K2 (lower), extracted from the continuum-subtracted cube. Key emission features are labelled. The Hβ, [OIII], Hα, and [NII] emission features are modelled with a two-component Gaussian, consisting of a broad (blue) and narrow (pink) component. The black line shows the total best-fit model. |
| In the text | |
|
Fig. 7. BPT diagram showing the dominant ionising source of K1 and K2, based on the diagnostic models of Kauffmann et al. (2003, dotted) and Kewley et al. (2001, dashed). The region of the diagram consistent with shock heating (Alatalo et al. 2016) is overlaid (pink). |
| In the text | |
|
Fig. 8. Spectrum taken from a single pixel at the position of the CON. Key emission features are labelled. The Hβ, [OIII], Hα, and [NII] emission features are modelled with a two-component Gaussian, consisting of a broad (blue) and a narrow (pink) component. The black line shows the total best-fit model. |
| In the text | |
|
Fig. 9. HST imaging showing the V-shaped dust columns in the f555w (left) and f814w (right) bands. Contours showing the integrated intensity of Hα are overlaid. The position of the CON in each image is shown by a black cross. The direction and extent of the faint radio jet detected in Falstad et al. (2018) is illustrated with the white arrow. The two dust pillars are labelled. |
| In the text | |
Current usage metrics show cumulative count of Article Views (full-text article views including HTML views, PDF and ePub downloads, according to the available data) and Abstracts Views on Vision4Press platform.
Data correspond to usage on the plateform after 2015. The current usage metrics is available 48-96 hours after online publication and is updated daily on week days.
Initial download of the metrics may take a while.