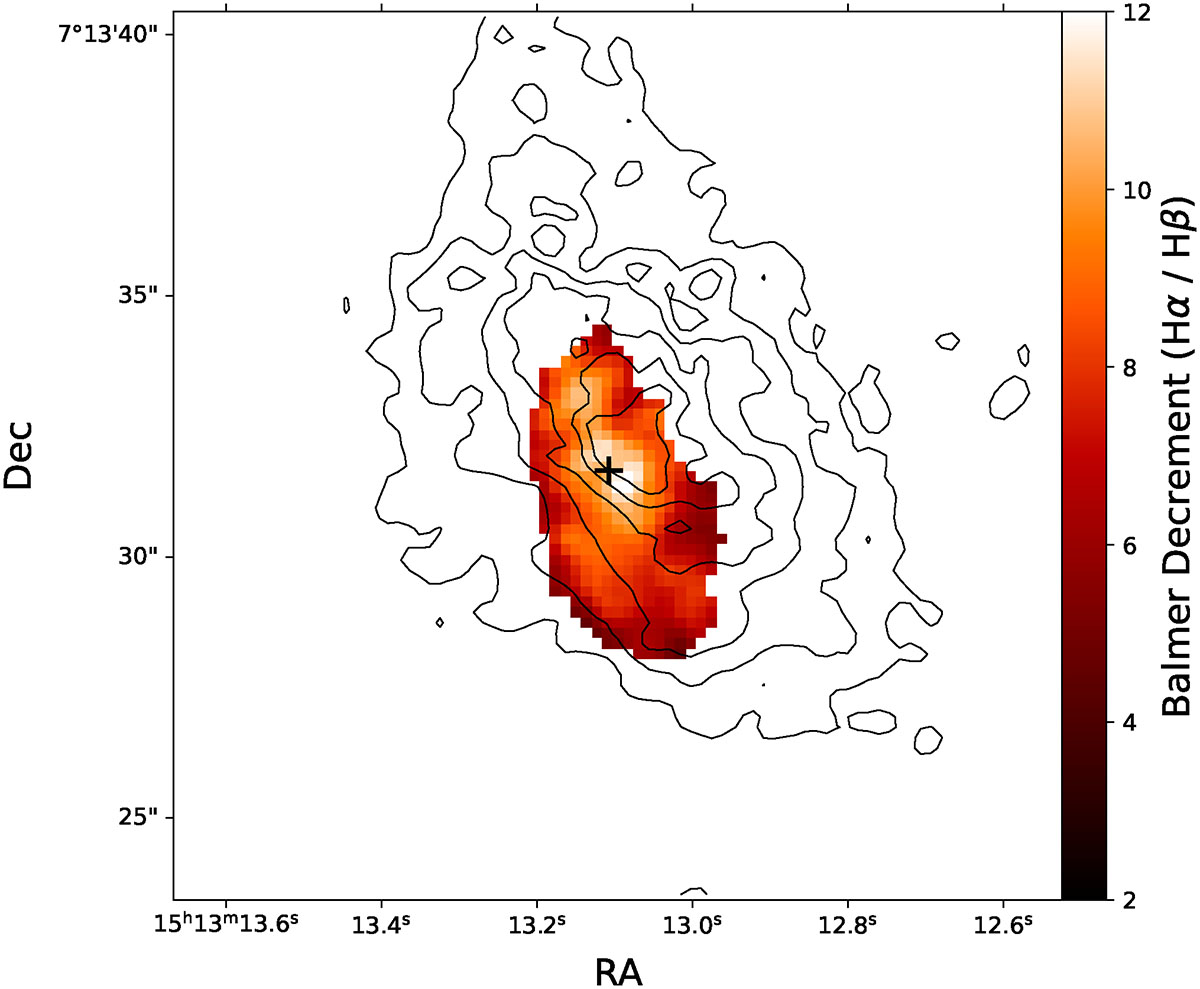
Fig. 4.
Download original image
Comparison of the dust structures in Zw049 derived from the best-fit E(B − V) value template for the stellar reddening (contours) and the Balmer decrement (image). Contours levels denote E(B − V) = 0.1, 0.2, 0.3, 0.4, 0.5, and 0.6. The black cross denotes the position of the CON source for reference. A 3σ noise cut has been applied to the Balmer decrement map to include only pixels for which both Hα and Hβ lie above this noise threshold. The map has been smoothed with a 1σ Gaussian kernel to improve the visual output.
Current usage metrics show cumulative count of Article Views (full-text article views including HTML views, PDF and ePub downloads, according to the available data) and Abstracts Views on Vision4Press platform.
Data correspond to usage on the plateform after 2015. The current usage metrics is available 48-96 hours after online publication and is updated daily on week days.
Initial download of the metrics may take a while.