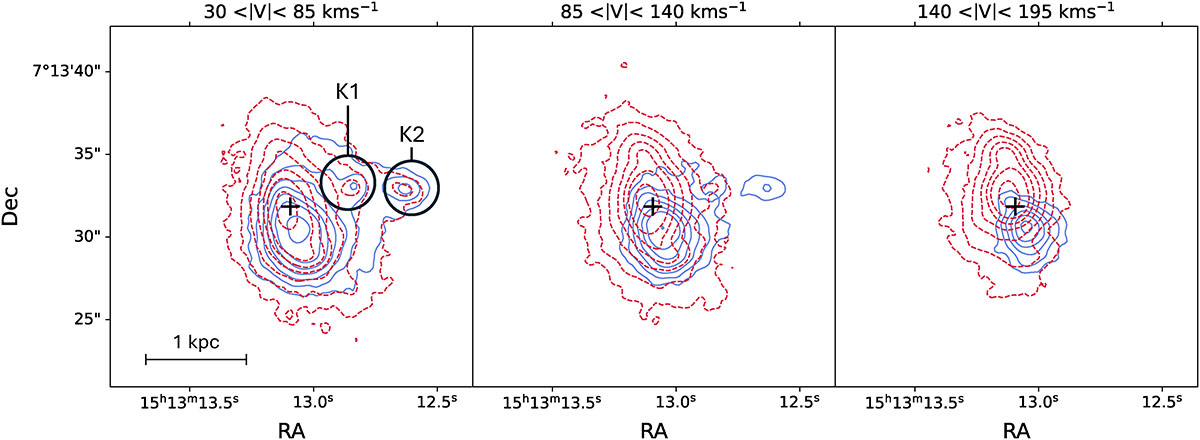
Fig. 5.
Download original image
Channel maps for the blue (solid blue contours) and red (dashed red contours) line wings of the Hα emission in Zw049. Each panel denotes one spectral channel, offset from the central line position by one, two, and three channels (left to right), with the corresponding velocity given above. The black cross marks the position of the CON source in each image.
Current usage metrics show cumulative count of Article Views (full-text article views including HTML views, PDF and ePub downloads, according to the available data) and Abstracts Views on Vision4Press platform.
Data correspond to usage on the plateform after 2015. The current usage metrics is available 48-96 hours after online publication and is updated daily on week days.
Initial download of the metrics may take a while.