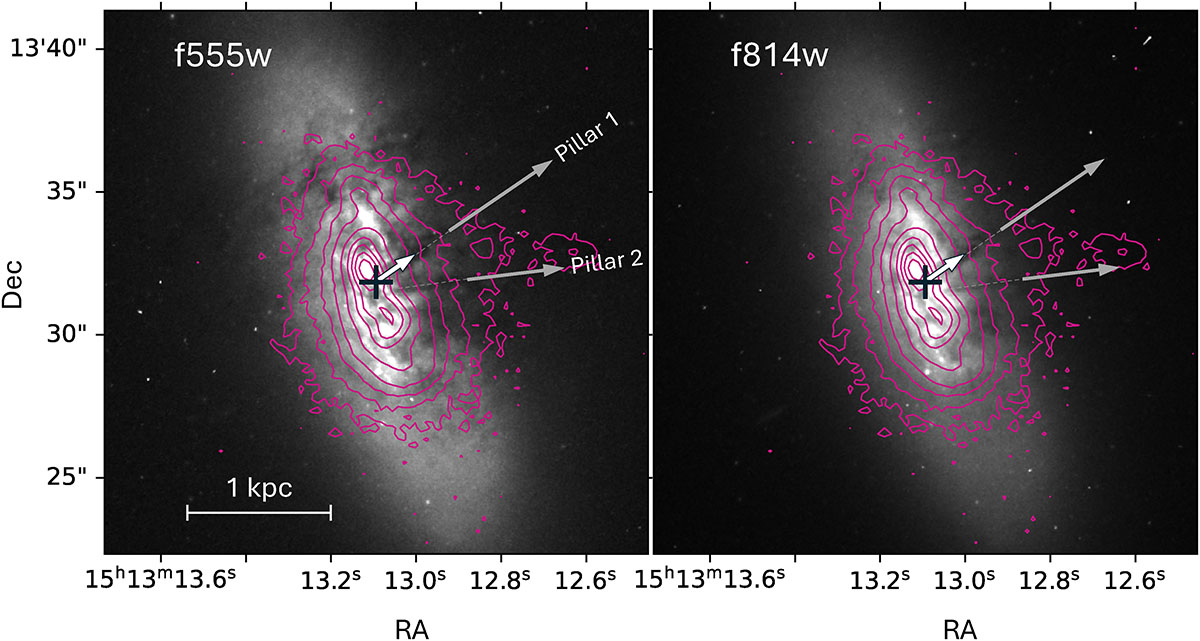
Fig. 9.
Download original image
HST imaging showing the V-shaped dust columns in the f555w (left) and f814w (right) bands. Contours showing the integrated intensity of Hα are overlaid. The position of the CON in each image is shown by a black cross. The direction and extent of the faint radio jet detected in Falstad et al. (2018) is illustrated with the white arrow. The two dust pillars are labelled.
Current usage metrics show cumulative count of Article Views (full-text article views including HTML views, PDF and ePub downloads, according to the available data) and Abstracts Views on Vision4Press platform.
Data correspond to usage on the plateform after 2015. The current usage metrics is available 48-96 hours after online publication and is updated daily on week days.
Initial download of the metrics may take a while.