Open Access
Fig. 10.
Download original image
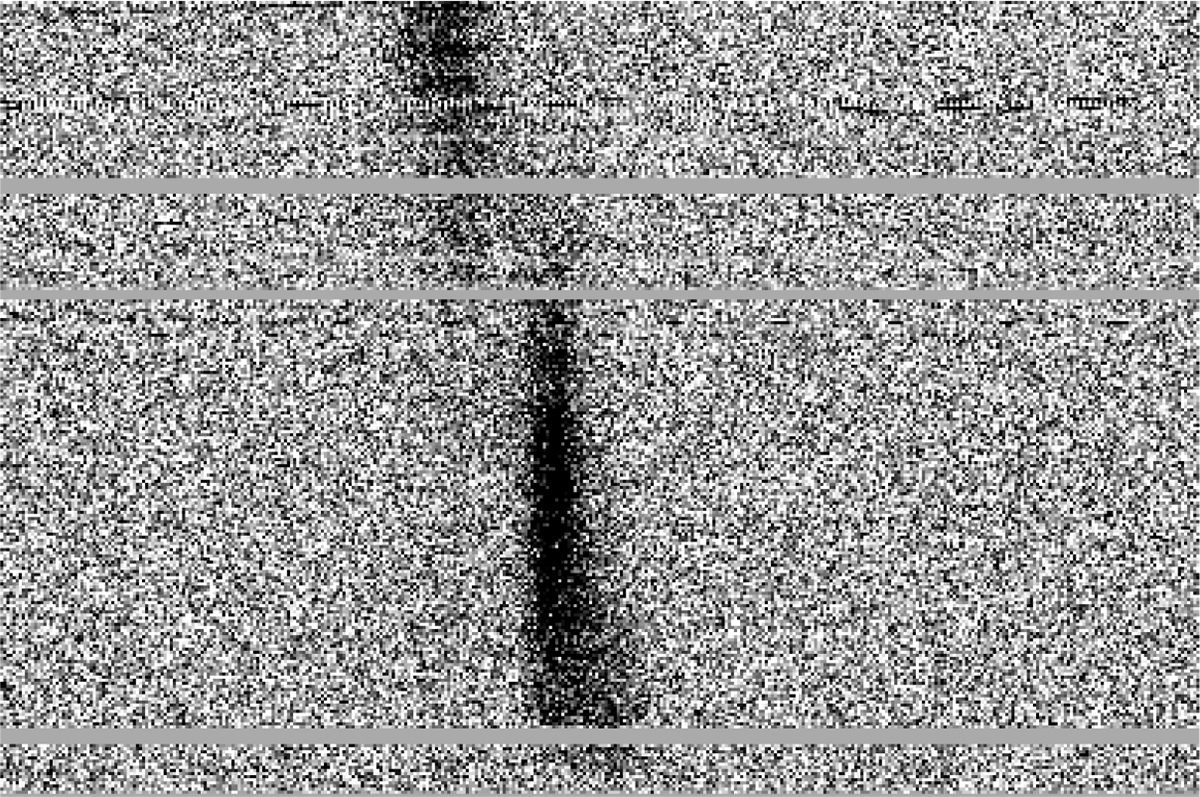
Waterfall (frequency-time) plot of one of the brightest bursts detected at NRT on 2019-09-07. The lateral panel on the top shows the amplitude in Jy as a function of time, while the lateral panel on the right shows the spectrum.
Current usage metrics show cumulative count of Article Views (full-text article views including HTML views, PDF and ePub downloads, according to the available data) and Abstracts Views on Vision4Press platform.
Data correspond to usage on the plateform after 2015. The current usage metrics is available 48-96 hours after online publication and is updated daily on week days.
Initial download of the metrics may take a while.