| Issue |
A&A
Volume 704, December 2025
|
|
|---|---|---|
| Article Number | A25 | |
| Number of page(s) | 11 | |
| Section | Astrophysical processes | |
| DOI | https://doi.org/10.1051/0004-6361/202453148 | |
| Published online | 26 November 2025 | |
Long-term monitoring of FRB 20121102A with the Nançay Radio Telescope and multiwavelength campaigns including INTEGRAL
1
Université Paris-Saclay, Université Paris-Cité, CEA, CNRS, AIM, 91191 Gif-sur-Yvette, France
2
LPC2E, OSUC, Univ Orléans, CNRS, CNES, Observatoire de Paris, F-45071 Orléans, France
3
ORN, Observatoire de Paris, Université PSL, Univ Orléans, CNRS, 18330 Nançay, France
4
Institut d’Astrophysique de Paris (IAP), UMR7095, CNRS and Sorbonne Université, F-75014 Paris, France
5
Centre for Astronomy, School of Natural Sciences, University of Galway, H91 TK33 Galway, Ireland
6
Astrophysics Research Cluster, School of Mathematical and Physical Sciences, University of Sheffield, Sheffield S3 7RH, UK
7
Instituto de Astrofísica de Canarias, E-38205 La Laguna, Tenerife, Spain
8
AIM, CEA, CNRS, Université Paris-Saclay, Université Paris Diderot, Sorbonne Paris Cité, 91191 Gif-sur-Yvette, France
9
MIT Kavli Institute for Astrophysics and Space Research, Massachusetts Institute of Technology, 77 Massachusetts Ave, Cambridge, MA 02139, USA
10
Max-Planck-Institut für Radioastronomie, Auf dem Hügel 69, D-53121 Bonn, Germany
11
LIRA, Observatoire de Paris, Université PSL, Sorbonne Université, Université Paris Cité, CY Cergy Paris Université, CNRS, 92190 Meudon, France
⋆⋆ Corresponding author: This email address is being protected from spambots. You need JavaScript enabled to view it.
Received:
25
November
2024
Accepted:
1
September
2025
Abstract
Context. The origin(s) of fast radio bursts (FRBs), mysterious radio bursts coming from extragalactic distances, remains unknown. Multiwavelength observations are arguably the only way to answer this question unambiguously.
Aims. We attempt to detect hard X-ray/soft γ-ray counterparts to one of the most active FRB sources, FRB 20121102A, as well as improve our understanding of burst properties in radio through a long-term monitoring campaign using the Nançay Radio Telescope (NRT).
Methods. Multiwavelength campaigns involving the International Gamma-ray Astrophysics Laboratory (INTEGRAL) satellite, the Nançay Radio Observatory, the optical telescopes at the Observatoire de Haute-Provence, as well as Arecibo were conducted between 2017 and 2019. In 2017, the telescopes were scheduled to observe simultaneously between September 24–29. We specifically used the Fast Response Enhanced CCDs for the optical observations to ensure a high time resolution. In 2019, we changed the strategy to instead conduct ToO observations on INTEGRAL and other available facilities upon positive detection triggers from the NRT.
Results. In the 2017 campaign, FRB 20121102A was not in its burst active phase periodic window. We obtain a 5σ optical flux limit of 12 mJy ms using the GASP and a 3σ limit from OHP T120cm R-band image of R = 22.2 mag of any potential persistent emission not associated with radio bursts. In the 2019 campaign, we have simultaneous INTEGRAL data with at least 11 radio bursts from the NRT and Arecibo. We obtain a 5σ upper limit of 2.7 × 10⁻⁷ erg cm−2 in the 25–400 keV energy range for contemporary radio and high energy bursts, and a 5σ upper limit of 3.8 × 10⁻¹¹ erg cm−2 for permanent emission in the 25–100 keV energy range. In addition, we report on the regular observations from NRT between 2016–2020, which account for 120 additional radio bursts from FRB 20121102A. We observe temporal dispersion measure (DM) variations at a level of ΔDM ∼ +2.04(4) pc cm−3/yr, in broad agreement with the literature. We also present an updated fit of the periodic active window, the emission bandwidth and the burst width distribution.
Key words: radiation mechanisms: non-thermal / methods: observational / gamma rays: general / radio continuum: general
Deceased on February 26, 2023.
© The Authors 2025
 Open Access article, published by EDP Sciences, under the terms of the Creative Commons Attribution License (https://creativecommons.org/licenses/by/4.0), which permits unrestricted use, distribution, and reproduction in any medium, provided the original work is properly cited.
This article is published in open access under the Subscribe to Open model. This email address is being protected from spambots. You need JavaScript enabled to view it. to support open access publication.
1. Introduction
The fast radio burst (FRB) phenomenon was first discovered in 2007 by Duncan Lorimer (Lorimer et al. 2007) in the reprocessing of Parkes Magellanic Cloud archival data in a search targeting fast transients. These bright, short-duration radio bursts have high dispersion measures (DMs), which point to extragalactic origins. While most FRBs appear to be one-off events, the first ever detection of repeated bursts from FRB 20121102A fundamentally changed our understanding of FRBs, and remains one of the most-studied FRB sources in the literature.
Initially discovered by the 305-m Arecibo radio telescope PALFA survey (Spitler et al. 2014), FRB 20121102A was found to repeatedly burst (Spitler et al. 2016). It was subsequently detected by other radio telescopes, emitting from ∼600 MHz (Josephy et al. 2019) to ∼8 GHz (Gajjar et al. 2018). FRB 20121102A shows a diverse range of burst morphologies (Hewitt et al. 2022). It is also one of the most active FRBs, with a burst rate1 as high as 218±16 h−1 over a 49-minute scan detected by the Arecibo radio telescope (Jahns et al. 2023). An active phase with a periodicity of about 157 days was reported by Rajwade et al. (2020) and Cruces et al. (2021), and has recently been updated to be 159.3(2) days by Braga et al. (2025).
The repetition of FRB 20121102A enabled, for the first time, interferometric follow-up observations using the Karl G. Jansky Very Large Array (VLA). Thanks to the accurate localization capability of the VLA with a resolution better than 100 mas, FRB 20121102A was pinpointed to a faint dwarf galaxy with a persistent radio counterpart (Chatterjee et al. 2017). Milliarcsecond localization capability was then achieved with the European Very Long Baseline Interferometry (VLBI) networks, where the FRB was detected to colocate with a persistent radio source with a compact size of less than 0.7 pc (Marcote et al. 2017). In parallel, spectroscopic observations using the Gemini Multi-Object Spectrograph (GMOS) identified the host galaxy as a low-metallicity dwarf galaxy at a redshift of z = 0.192 (about three billion light-years away), and showed that the galaxy’s center offsets the persistent radio source by 200 mas (Tendulkar et al. 2017).
Even though the precise nature of the progenitor of FRB 20121102A remains a mystery, these observations have provided important clues to help piece the puzzle together. First of all, the repeating nature of FRB 20121102A rules out any cataclysmic theoretical models. Tendulkar et al. (2017) suggested that the host galaxy of FRB 20121102A is a typical home for long gamma-ray bursts (GRBs) and superluminous supernovae (SLSNe). Bassa et al. (2017) showed from high-resolution optical imaging observations that FRB 20121102A coincides with a compact region with prominent emission lines characteristic of intense star formation. Michilli et al. (2018) observed high Faraday rotation and nearly 100% linear polarization emission in the radio bursts, which supports the scenario where the FRB is a compact source of stellar origin embedded in extremely magnetic environments.
Similar to the case of the FRB from SGR 1935+2154 (Mereghetti et al. 2020), multiwavelength detections of any high-energy counterpart or afterglow associated would provide crucial constraints regarding the provenance of FRBs. Soft X-ray observations (Chandra and XMM-Newton) taken during detected radio bursts from FRB 20121102A detected no contemporaneous X-ray emission (Scholz et al. 2017). Nonetheless, several FRB progenitor models predict extended gamma-ray emission, for example, associated with magnetar and/or gamma-ray bursts (see, e.g., Zhang 2014; Liu et al. 2016; Murase et al. 2017; Wei et al. 2023). The project presented here attempts to detect hard X-ray/soft γ-ray (using INTEGRAL) and optical (using the Observatoire de Haute-Provence) counterparts to the radio emission of FRB 20121102A (using the Nançay Radio Observatory). In Section 2, we describe all the telescopes and instrument facilities involved in this study. In Section 3, we present the observational set up and the data processing. We discuss the results in Section 4. Finally, the conclusion is provided in Section 5.
2. Telescope facilities
2.1. INTEGRAL
The International Gamma-ray Astrophysics Laboratory (INTEGRAL) satellite was launched on October 17, 2002. With a nominal operation lifetime of five years, INTEGRAL continues to collect data to date. INTEGRAL has a highly elliptical (51°) and large (72 h) orbit. There are four Science Instruments on board INTEGRAL, including the Spectrometer on Integral (SPI), the Imager on board Integral Satellite (IBIS), the Joint European X-ray Monitor (JEM-X) and the Optical Monitoring Camera (OMC). For this project, we used IBIS, which makes images with a 30 × 30 deg2 field of view (Ubertini et al. 2003). The INTEGRAL Soft Gamma Ray Imager (ISGRI) collects photon-by-photon events in the band 15–1000 keV with a time resolution around 100 μs (Lebrun et al. 2003). Data processing was carried out using the standard INTEGRAL Offline Scientific Analysis (OSA) software, version 11.22.
2.2. Nançay Radio Observatory
The Nançay Radio Observatory is located in the department of Cher in the center of France. Two telescopes at Nançay were involved in this project.
2.2.1. Nançay Radio Telescope (NRT)
The Nançay Radio Telescope (NRT) is a Kraus-type meridian telescope, with a tiltable, planar primary reflecting surface spanning 200 m × 40 m and a secondary reflecting surface in the shape of a spherical segment spanning 300 m × 35 m. The NRT has the effective sensitivity of a 100-m class radio telescope, with a system temperature of 35 K and a telescope gain of 1.4 K Jy−1. The observations described in this paper were acquired using the low-frequency receiver (1.1–1.8 GHz) at the focal plane using the FORT (Foyer Optimisé pour le Radio Télescope) receiver system, providing 512 MHz of bandwidth centered at 1484 MHz in 128 channels. These data were recorded in eight subbands, each with sixteen 4-MHz channels, using the Nançay Ultimate Pulsar Processing Instrument (NUPPI; Desvignes et al. 2011) with a native time resolution of 64 μs sampled at 4 bits. Only polarization-summed intensity data were recorded, and the data were not coherently dedispersed. Offline single pulse search was conducted using the PRESTO3 software (Ransom 2011).
2.2.2. NenuFAR
The other telescope from Nançay is the New Extension in Nançay Upgrading LOFAR (NenuFAR4) (Zarka et al. 2020). The core array of NenuFAR consists of 96 mini-arrays, each with 19 dual polarization antennas covering an area of about 400 m in its longest baseline. NenuFAR can operate between 10−85 MHz and it is one of the most sensitive radio telescopes below 85 MHz. At the time of this project, NenuFAR was still in the commissioning stage and only 56 mini-arrays were included. We recorded data using the beamformed TF (Time-Frequency) mode with the UnDySPuTeD backend (Bondonneau et al. 2021). The output dynamic spectra have not been coherently dedispersed. We kept data from 44.8–82.3 MHz with a frequency resolution of 3.05 kHz and a time sampling rate of 21 ms at a bit depth of 8. Only one beam is formed at the nominal position of the FRB. The recorded data are searched offline for potential FRB signals following the procedure described in Decoene et al. (2023).
2.3. Observatoire de Haute-Provence
While little is known about expectations of a possible optical counterpart to an FRB, it is clear that if the duration of the optical burst is as short as the radio one, the chances of detecting it with standard Charge-Coupled device (CCD) cameras are reduced (e.g., Yang et al. 2019), as the signal would be diluted in the longer exposures needed to reach a significant magnitude limit. We therefore used both classical CCD cameras and Fast Response Electron Multiplying CCD (EMCCD) cameras for this campaign.
The Galway Astronomical Stokes Polarimeter (GASP) Collins et al. (2013), Kyne (2014), O’Connor (2018, 2018) was mounted at the Cassegrain focus of the 1.93-m telescope of the Observatoire de Haute-Provence (OHP). GASP uses two EMCCD cameras with a 512 × 512 pixel format full frame. For fast images with the 1.93-m telescope, 24 × 256 pixel frames were used with a pixel scale of 0″.42/pixel. Each of the EMCCD cameras was run at a nominal gain of 1000, the measured gains of the two detectors were 1330 and 1370. Observations were conducted in the R-band, which is the most efficient setting for GASP, with a frame rate of 1102.5 Hz, giving a frame time of 907 μs.
Simultaneously, we also used the classical CCD camera mounted at the Newton focus of the 1.20-m telescope. The OHP-120cm has a 2048 × 2048 CCD, with a scale of 0″38 per pixel (used here in bin 2 mode), for a total field of view of 13.1 arcminutes a side. The two-telescope setup allows us to better discriminate any spurious signals and/or confirm any candidate.
The first half of the night was used for calibration observations. These were taken of polarimetric standards and of the Crab pulsar, coordinated between the 1.93-m and the 1.2-m telescopes. The Crab pulsar was observed at a frame rate of 0.9 ms. The final time series can be folded in phase with the Jodrell Bank ephemeris to create phase-resolved linear and circular polarimetric light curves. As a 2D polarimeter GASP also measures the background polarization and nearby secondary polarization standards can be measured. The dispersion measure of FRB 20121102A implies a dispersive delay of ≈2 s between the OHP optical band and any radio burst at 1.4 GHz. Optical transients around the expected window back extrapolated from potential radio detections can be done similarly to the procedure used in the determination of the optical enhancement associated with giant radio bursts in the Crab pulsar (Shearer et al. 2003).
2.4. Arecibo
Observations taken with the 305 m William E. Gordon Telescope at the Arecibo Observatory were obtained as part of a Director’s Discretionary Time (DDT; project code P3219). The C-lo receiver and the PUPPI pulsar backend were used to record filterbank files between 4.1–4.9 GHz, with a frequency resolution of 1.56 MHz and time resolution of 10.24 μs. The observations were coherently dedispersed to a DM of 557 pc cm−3. The PRESTO-based search procedure has been described in Cruces et al. (2021). In summary, we downsample the intensity data to 81.92 μs and 12.48 MHz and searched between the DM range of 507 and 606 pc cm−3 with a DM step size of 1 pc cm−3. We convolve the dedispersed time series with a template bank of boxcar filters up to 40 ms. Candidates above a signal-to-noise threshold of 6 were inspected visually.
3. Observation campaigns
Two separate multiwavelength campaigns on FRB 20121102A have been carried out. See Table 1 for a summary of the observation logs.
Summary of joint γ-Ray/Optical/Radio observations on FRB 20121102A.
3.1. The 2017 campaign
We were granted two orbits of INTEGRAL time on FRB 20121102A in pointing mode between September 24–29, 2017 (Proposal ID: 1420030). The eccentric orbit of the satellite enables continuous observations to be made of the pointed target for nearly three days, except when the spacecraft trajectory enters into the radiation belts. An image at the sky position of FRB 20121102A taken during revolution 1867 can be seen in Fig. 1. The upper limit of any persistent emission that is not associated with a radio burst, at FRB 20121102A position, is 5.5 × 10⁻¹¹ erg cm−2 in the 25–100 keV energy range.
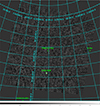 |
Fig. 1. INTEGRAL image at the sky position of FRB 20121102A taken during revolution 1867 at 25–100 keV. The grayscale bar gives the sources significance over the field of view. Only the Crab pulsar is clearly detected at more than 50 sigmas (given a detection threshold of 5 sigma). |
The goal of this campaign was to conduct multi-telescope observations on FRB 20121102A during this allocated INTEGRAL period. On the radio side, the NRT was supposed to be the primary instrument. However, due to a major failure of the hydraulic system used for the receiver motion along its track, the NRT was out of operation during this long-planned campaign. Arecibo was affected by hurricane Maria and was also not able to collect any data. Only Effelsberg obtained data during this campaign and this data set has been published in Cruces et al. (2021). Unfortunately, no radio bursts were detected in 60 hours of observations, which means no trigger was sent for INTEGRAL. Retrospectively, this non-detection is not surprising because based on the active phase periodic window later published by Cruces et al. (2021), Rajwade et al. (2020), Li et al. (2021), the dates of the 2017 campaign fall within a period of inactivity of FRB 20121102A (see also Fig. 6).
In the optical band, we were awarded seven nights of OHP time, two of which were technical nights for the setting-up of GASP, and two other nights where poor sky conditions prevented observations. We were left with four nights (a total of 13 h) of OHP observations of FRB 20121102A using GASP from September 25 to 29 in the 2017 campaign. The start and end times listed in Table 1 are all UTC based on a GPS trigger with an accuracy better than 1 μs. Even though FRB 20121102A was at a low elevation angle, we had an 85% efficiency in terms of weather conditions and telescope time. The sky was dark as the new moon was on the 19th, and the airmass was less than 1.4. As there were no radio events during these observations, only a 5σ optical flux limit could be determined at a level of 12 mJy ms (Fig. 2).
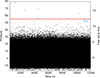 |
Fig. 2. GASP observation of FRB 20121102A from the 2017 campaign. The plot, from the night of September 27, shows the flux in each 0.9-ms frame. In total, there were ≈13.7 million frames. Shown are the EMCCD counts (left y axis) from the FRB region in each frame (left y-axis) and the flux in mJy ms (right y axis). Also shown is the 5σ upper limit. From 13.7 million frames, we expected to observe 4.1 frames with a flux above 5σ. The fact that we see five frames above 5σ implies no significant enhancement is detected. |
At the same time, deep R-band images of the field of FRB 20121102A were obtained with the OHP 120-cm telescope and its direct CCD camera. Consecutive exposures of 300 s were obtained on September 24, 26, 27 and 28, 2017. Each individual image was flat-fielded and carefully inspected, but no detection was found at the location of the FRB. The total integration time of 685 min was used to make a stacked image. Similarly, we do not detect any signal in the finally combined image, down to a 3σ limit of R = 22.2 mag (see Fig. 3).
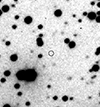 |
Fig. 3. 1.5′ × 1.5′ sub-section of our R-band stacked image obtained in the field of FRB 20121102A with the T120cm telescope at Observatoire de Haute-Provence. The expected location of FRB 20121102A is indicated with the empty black circle at the center. North is to the top and east is to the left. |
3.2. The 2019 campaign
We changed our approach in 2019, proposing instead to conduct Target of Opportunity (ToO) observations with INTEGRAL (Proposal ID: 1640014). We were awarded three orbits each lasting about 2.5 days. Again using the NRT as the primary radio telescope, our strategy was that if radio bursts were detected in at least two over three one-hour long successive observations with the NRT, then we would have the confidence that FRB 20121102A is in an active status and INTEGRAL would be triggered. Positive detections from NRT happened at the end of August, and we successfully triggered INTEGRAL to point to FRB 20121102A. In addition to the three orbits, calibration observations of the Crab Pulsar taken on September 10 also covered the location of FRB 20121102A. In total, these INTEGRAL data coincide with 11 bursts from NRT and eight bursts from Arecibo. We have also sent out an Atel (ID:13073) to announce the times of the INTEGRAL ToO observations and encouraged other facilities to take part in the follow-up observations.
In order to narrow down the precise burst moment in the INTEGRAL data, we converted the burst time of arrivals at NRT to barycentric and translated the time stamps to INTEGRAL Julian Date (IJD). We have a total of 11 radio bursts with coincident photons during INTEGRAL observations (see Tables 1 and B.1). Seven of these were during the three awarded INTEGRAL orbits while four additional bursts came during later calibration observations of the Crab pulsar. If we consider a burst window size of 5 ms, as it was done for the XMM Newton analysis presented in Scholz et al. (2017), no INTEGRAL/ISGRI emission was detected in coincidence with these 11 radio bursts, with a 5σ upper limit of 2.7 × 10⁻⁷ erg cm−2 5 in the 25–400 keV energy range. Furthermore, no persistent emission was detected from an analysis of the INTEGRAL/ISGRI flux density during the 2019 campaign, with a 5 sigmas upper limit of 3.8 × 10⁻¹¹ erg cm−2 in the 25–100 keV energy range, assuming a Crab-like, powerlaw spectrum with an index of 2 (Refer to Fig. 5).
Supporting radio observations were arranged with Arecibo, Effelsberg and NenuFAR to coincide with the NRT campaign (Fig. 4). The NRT analysis is separately discussed in Section 3.3. Six consecutive days of observations were obtained at NenuFAR between September 1 to 6, 2019. On each day, a 30 min scan was recorded on the sky position of FRB 20121102A. No positive detection was made. A total of nine bursts were detected from Arecibo during two ∼2 h-long observations taken on August 31 (burst MJDs: 58726.49465635, 58726.46079819, 58726.46407909) and September 3 (burst MJDs: 58729.45553347, 58729.46330519, 58729.46529836, 58729.47564011, 58729.45170017, 58729.45795891). Positive detections with Effelsberg were published in Cruces et al. (2021) and are not further discussed in this paper. We are aware that the FAST telescope (see also, Atel ID:13064; Li et al. 2021) and MeerKAT (Atel ID:13098) have also detected radio bursts from FRB 20121102A during this active phase periodic window.
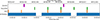 |
Fig. 4. Time windows of the telescope facilities that participated in the 2019 campaign. Each radio burst detected is shown as a vertical black tick. |
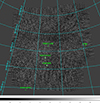 |
Fig. 5. INTEGRAL image at the sky position of FRB 20121102A at 25–100 keV, stacking all observations taken during the 2019 campaign. The grayscale bar gives the sources significance over the field of view. |
3.3. NRT analysis
In addition to the 11 bursts simultaneous with INTEGRAL in September 2019, a long-term monitoring campaign of FRB 20121102A took place between 2016–2020 (MJD 57481–59371) (Fig. 6). This is a total of 580 observations summing up to 512.5 h, in which a total of 131 radio bursts were detected. An example of an NRT burst is shown in Fig. 10. We derived burst parameters for each of these detections using the public software FITBURST6 (Fonseca et al. 2024). Table B.1 lists the results from this fitting analysis, including the burst arrival time in MJD, the DM, the burst width, and emission bandwidth of the NRT burst sample.
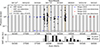 |
Fig. 6. (Top panel) Fluences vs date (black dots) of the NRT detected bursts from FRB 20121102A. Non-detections from NRT are indicated by small gray tick marks at the bottom of the panel. The epochs of the INTEGRAL observations are marked by vertical orange lines. We also include the time stamps of the observations with bursts and non-detections from Braga et al. (2025) (blue) and Wang et al. (2025) (red). Note that these positive-detection data points from the literature are arbitrarily placed at y = 1 Jy ms as fluence info is not readily available. The grayed region indicates an active window as calculated by combining all these data. We obtain a period of 158.1(3) days, referencing MJD = 50127.5 and an activity window of 62% centered at phase = 0.5. (Bottom panel) The duration of NRT observations in each active (gray) and inactive (dark gray) period are shown. |
We attempted to derive an updated activity periodicity window by combining the NRT data set presented in this paper and those published in Braga et al. (2025), Wang et al. (2025), which should incorporate all known bursts of FRB 20121102A from its first discovery in 2012 up to 2023 (see also Fig. 6). This amounts to 217 observations with bursts and 753 observations with non-detections. We use the Lomb-Scargle periodicity search code developed by Cruces et al. (2021) and Braga et al. (2025), and choose the binary model with psd normalization, we obtain a periodicity of 158.1(4)7 days, which is largely consistent with the 159.3(8) days reported in Braga et al. (2025) and the 156.9 days reported in Wang et al. (2025). We obtain an activity phase window of 62% centered at phase = 0.5, which agrees with Wang et al. (2025), but is wider than the 53% stated in Braga et al. (2025). If we were to use the phase-folding method where the activity window duty cycle is minimized, then we obtain a periodicity of ∼156 days and a duty cycle of 56%. This shows that despite having a data set that spans over 25 activity cycles, there remains uncertainty and variations of the order of a few days on the activity periodicity and of the order of a few % in the duty cycle for FRB 20121102A.
Figure 8 shows the temporal DM variations of FRB 20121102A. We note that as explained in Fonseca et al. (2024), the DM values derived from FITBURST are optimized by the signal-to-noise ratio for single-component, Gaussian-like bursts. For bursts with multiple components (which is the case for seven bursts in this NRT sample; see Table B.1), FITBURST optimizes the morphology structure instead and returns a best-fit DM value to be applied to all the components of the same burst. This should help to minimize bias in DM due to temporal, frequency-dependent substructures, such as downward drifting morphologies or the so-called “sad-trombones” feature (Hessels et al. 2019). Combining the 131 bursts from NRT from this paper as well as the literature results obtained from Arecibo and Green Bank (Hessels et al. 2019), Westerbork (Oostrum et al. 2020), MeerKAT (Platts et al. 2021), and FAST (Li et al. 2021), the NRT data fill in a time gap where no previous data existed. Fitting a linear trend through all these data points, weighted by the clustering density and DM uncertainty, we see an increase of ΔDM ∼ +2.04(4) pc cm−3/yr, in broad agreement with early results from Hessels et al. (2019), but slightly larger than the +0.8(1) pc cm−3/yr reported in Li et al. (2021).
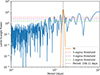 |
Fig. 7. Lomb-Scargle periodogram for binary detection mode following the code from Braga et al. (2025), applied to the NRT data set combined with all historical data from Braga et al. (2025) and Wang et al. (2025). The first candidate of the periodogram is a periodicity of 158.1(3) days, indicated by the vertical dashed line. The dotted horizontal lines correspond to the 1σ, 3σ, and 5σ significance levels determined by conducting 10000 bootstrap resamplings. |
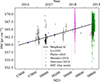 |
Fig. 8. Temporal DM variation seen in FRB 20121102A. The linear trend is fitting by taking into account the clustering density of the data points as well as the uncertainty associated with each DM. |
The highest burst rate detected in contiguous data at the NRT is 24.4 bursts/h (17 bursts between MJD 57826.741875–57826.770880). This is less than the 122 bursts/h observed by the FAST telescope (Li et al. 2021) and the 218 bursts/h observed by Arecibo (Jahns et al. 2023); not a surprise as FAST and Arecibo have a much higher sensitivity than the NRT. The NRT, Arecibo, and FAST burst rates are much higher than, for example, that detected by CHIME between the lower observing frequencies of 400–800 MHz, where only one burst has been recorded during multiple years of operation (Josephy et al. 2019). As suggested by Houben et al. (2019), this is possibly explained by a flattening of the spectrum of FRB 20121102A below 1 GHz.
Figure 11 shows a 2D histogram of the bandwidth versus central frequency of the NRT bursts. Some of the NRT-detected bursts emit in the full NRT band (1230–1740 MHz), while others are confined to specific ranges of this window. Table B.1 lists the emitting range for each of the NRT-detected bursts. On average, NRT bursts have a median emission bandwidth of 285 MHz. A large number of the data points on Fig. 11 lie near the edge of the triangle, implying that these bursts are likely to have even wider emission bandwidths, but are restricted by the receiver band of the NRT. This result is in slight contrast to the Arecibo data set used in Aggarwal et al. (2021) which showed a lack of emission below 1300 MHz and a narrower median width of 230 MHz.
Seven NRT bursts (∼5%) show multicomponent or downward drifting morphology (see an example in Fig. 10), while the majority of the NRT bursts appear to be Gaussian-like bursts. We do not observe complex bifurcating structures as seen in the MeerKAT data set used in Platts et al. (2021). We observe a log-normal burst width distribution centered around 1.6 ms (Fig. 9). This is narrower than the 4 ms found by FAST (Li et al. 2021), although the FAST reported widths are ‘equivalent widths’ which is different from the FWHM width we obtained using FITBURST. Also, (Li et al. 2021) mentioned that the bursts with complex profiles might have overestimated widths, whereas in our case, bursts with multiple components are fit component by component in FITBURST and then summed to obtain the final reported width for that event.
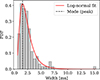 |
Fig. 9. Probability density functions (PDFs) for the NRT burst width distributions. |
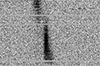 |
Fig. 10. Waterfall (frequency-time) plot of one of the brightest bursts detected at NRT on 2019-09-07. The lateral panel on the top shows the amplitude in Jy as a function of time, while the lateral panel on the right shows the spectrum. |
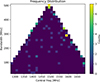 |
Fig. 11. Frequency distribution of the central frequencies and the bandwidth for the NRT burst sample. |
4. Discussion
FRB 20121102A has been found to be in a star-forming region (Bassa et al. 2017) of a host galaxy of low metallicity (Tendulkar et al. 2017). These clues are consistent with the hypothesis of a magnetar progenitor model for FRB 20121102A, since these environments also favor sources like long gamma-ray bursts and hydrogen-poor SLSNe-I which are considered to be associated with magnetar births. Theoretically, models of FRBs from magnetars predict a small energy ratio between radio and high energy emission, as the radio energy budget is considered a small fraction of the total emitted energy. For example, Lyutikov (2002) estimated a radio-to-X-ray energy ratio of ∼10−4 based on analogies to solar flares. Margalit et al. (2020) expected a similar radio-to-gamma-ray ratio, while Lyubarsky (2014) suggested the energy ratio could be at 10−5–10−6 based on synchrotron maser interaction between the magnetic shock and the wind nebula of a magnetar. In our Milky Way, magnetars are known to produce both X-ray and gamma-ray bursts. A radio-to-X-ray energy ratio of ∼2 × 10⁻⁵ was reported for the simultaneous radio and X-ray (20–200 keV) detection from the FRB-like burst of magnetar SGR 1935+2154 (Mereghetti et al. 2020). The spectrum of this burst was harder than those of typical soft γ-ray repeaters (SGRs). These are motivations that magnetar-related gamma-ray detection of FRBs could be achieved.
In the literature and for FRB 20121102A specifically, Scholz et al. (2017) conducted simultaneous radio and X-ray observations which led to a 5σ fluence upper limit of 3 × 10⁻¹¹ erg cm−2 in the 0.5–10 keV Chandra band for burst durations < 700 ms and a 5σ upper limit of 4×10⁻⁹ erg cm−2 in 10–100 keV using Fermi. Assuming isotropic emission, these limits correspond to burst energy of the order of 1045 − 1047 erg (see blue lines in Fig. 12) at the distance of FRB 20121102A, which is measured to be at redshift z = 0.193 which equates to a luminosity distance of 972 Mpc (Tendulkar et al. 2017). They derived a radio-to-X-ray energy ratio of > 10−6 − 10−8, depending on the spectral model and the absorbing column. Following the radio-to-gamma-ray fluence ratio formula8η = F1.4 GHz/Fγ as defined in Tendulkar et al. (2017), Scholz et al. (2017) place a lower limit of η > 6 × 10⁹ Jy ms erg−1 cm2 for FRB 20121102A, although this is subjected to the extrapolation from soft X-ray to gamma-ray and included the assumption that the radio fluence is the same at 1.4 GHz and 2 GHz. If compare to the Fermi measurements at 10–100 keV, they obtain η > 2 × 10⁸ Jy ms erg−1 cm2. DeLaunay et al. (2016) found two bursts from FRB 20121102A that occurred within the field of view of Swift BAT which resulted in gamma-ray upper limit of the order of 2 × 10⁻⁶ erg cm−2 and η > 104.6 Jy ms erg−1 cm2 in the range of 15–150 keV.
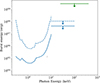 |
Fig. 12. Limits on the energy of X-ray and gamma-ray bursts at the time of radio bursts from FRB 20121102A (in blue; from Scholz et al. (2017) and in green; this work). The 0.5–10 keV data are from Chandra, 10–100 keV from Fermi/GBM and 25–400 keV from INTEGRAL. The dashed lines indicate 5σ upper limits for a single radio burst, whereas the solid lines indicate stacking multiple detected radio bursts. We do not include our optical limit in this plot as that was not obtained concurrently with radio bursts. |
In this work, we present 5σ upper limit of 2.7 × 10⁻⁷ erg cm−2 in the 25–400 keV energy range for contemporary radio and gamma-ray bursts, which is a more stringent limit than DeLaunay et al. (2016) while being in comparable wavelengths. Considering the distance of FRB 20121102A (972 Mpc; Tendulkar et al. 2017), this translates to a gamma-ray burst energy upper limit of 3 × 1049 erg (see green line in Fig. 12). Assuming the same radio fluence of F1.4 GHz = 1.2 Jy ms as reported in Tendulkar et al. (2017), we derive η > 4 × 10⁶ Jy ms erg−1 cm2 from our INTEGRAL campaign. This is still compatible with the radio-to-gamma-ray fluence ratio of a source similar to the Galactic magnetar SGR 1806−20, with ηSGR < 107 Jy ms erg−1 cm2 (Tendulkar et al. 2016). On the other hand, our limit excludes the vast majority (> 95%) of the short (T90 < 2 s), the long (2 s < T90 < 100 s) and the very long GRBs (T90> 100 s) based on the fluence distribution of GRBs published in Bhat et al. (2016). This makes the simultaneous presence of GRB and the radio bursts detected from the 2019 campaign of FRB 20121102A highly unlikely, although we cannot exclude GRB being a progenitor of FRB 20121102A (Margalit et al. 2019), as we have limited the scope of our study to contemporary multiwavelength detections. Our results also do not support an event like the claimed detection of FRB 20131104 (η = 6 × 10⁵ Jy ms erg−1 cm2) reported by DeLaunay et al. (2016).
The gamma-ray non-detection could be due to the extragalactic distance of the FRB, resulting in gamma-ray emission below the detectability of INTEGRAL. In addition, different beaming angles between the radio and high emission have been proposed by Sridhar et al. (2021), meaning these multiwavelength signals might not be correlated. It is also possible that the gamma-ray emission is heavily attenuated by the local environment, which could be the case as FRB 20121102A co-locates with a persistent radio source (PRS; Chatterjee et al. 2017) that might be a result of a pulsar wind nebula driven by the young magnetar (Kashiyama & Murase 2017). Indeed, Chen et al. (2023) conducted a comprehensive study of the PRS and found that the inferred size, and the flat radio spectrum favors a plerion origin. Alternatively, Metzger et al. (2017) proposed a scenario explained by the interaction between the supernova blast wave and the surrounding progenitor wind nebula. Finally, it is also possible that the radio bursts are amplified due to lensing events by the intervening medium (Cordes et al. 2017), meaning that the high energy emission could be much lower if the radio-to-high-energy fluence ratio holds.
The recently launched gamma-ray instrument known as the space-based multi-band astronomical variable objects monitor (SVOM; Wei et al. 2016) could provide improved sensitivity in the 15 keV–5 MeV range that would lead to a more stringent radio-to-gamma-ray fluence limit. We encourage further multiwavelength campaigns on FRBs, particularly the low redshifts repeating sources.
We also note that an optical burst fluence upper limit of 46 mJy ms was reported by Hardy et al. (2017) for FRB 20121102A during a period of time when 13 radio bursts were detected. Our optical limit of 12 mJy ms, based on the entire integration time, although more strigent, was taken during a radio quiet period where no radio burst was detected. Hence we do not have any knowledge of simultaneous radio/optical bursts and cannot compare our results directly with those in the literature.
5. Conclusions
We did not detect any contemporary bursts from FRB 20121102A in hard X-ray/soft γ-ray at the times when radio bursts were detected by the NRT and Arecibo during observations taken in 2019. Using the INTEGRAL satellite, we obtain a 5σ upper limit of 2.7 × 10⁻⁷ erg cm−2 in the 25–400 keV energy range for contemporary radio and high energy bursts, and a 5σ upper limit of 3.8 × 10⁻¹¹ erg cm−2 for permanent emission in the 25–100 keV energy range. The contemporary limit translates to a gamma-ray burst energy upper limit of 3×1049 erg and a fluence ratio of η > 4 × 10⁶ Jy ms erg−1 cm2. Optical observations taken at the OHP resulted in an upper limit of R = 22.2 mag and a flux limit of 12 mJy ms, although these were taken during a radio quiet period in 2017.
In addition, we report 131 radio bursts detected by the NRT between 2016–2019, which provides a more precise measurement of the activity periodic window of 158.1(3) days. We observe temporal DM variations at a level of ΔDM ∼ +2.04(4) pc cm−3/yr, in broad agreement with the literature. Seven (∼5%) bursts show multicomponent morphology. We note a log-normal burst width distribution centered around 1.6 ms and a random emission bandwidth distribution with a median bandwidth of 285 MHz, in broad agreement with recent results in the literature.
Data availability
Table B.1 is available at the CDS via https://cdsarc.cds.unistra.fr/viz-bin/cat/J/A+A/704/A25
The completeness energy threshold of the Arecibo burst rate is 7 × 1037 erg.
43 photons coincident with the 11 FRBs were detected. If we make a coded mask image with these photons (which is mathematically feasible even if the number is low), we get a flux of 25±17 photons at the FRB position. We use the uncertainty range of 17 photons to derive the quoted 5-sigma upper value, considering also a powerlaw spectrum with an index of 2.
The uncertainty corresponds to 95% confidence level in the SCIPY fit represented by the orange line in Fig. 7.
Since the emission bandwidth of repeating FRBs appears to vary, we choose not to multiply that by the radio fluence to report unitless η.
Acknowledgments
This manuscript is written in memory of Dr. Christian Gouiffès, who led this multiwavelength observation campaign of FRB 20121102A. Dr. Gouiffès unexpectedly passed away in 2023. The Nançay Radio Observatory is operated by the Paris Observatory, associated with the French Centre National de la Recherche Scientifique (CNRS). OHP is a department of Pytheas Institute in Marseille, co-directed by CNRS and Aix-Marseille University. This paper is based on observations with INTEGRAL, an ESA project with instruments and science data center funded by ESA member states (especially the PI countries: Denmark, France, Germany, Italy, Switzerland, Spain) and with the participation of Russia and the USA. We are very grateful for the help from Paul Scholz in producing this updated version of Figure 12, as well as the valuable guidance from Emmanuel Fonseca for the use of the FITBURST code. We thank Marilyn Cruces and Cristóbal Andrés Braga Viñals for kindly sharing the Lomb-Scargle periodicity code. The authors also thank Yong-kun Zhang for a discussion of the FAST results.
References
- Aggarwal, K., Agarwal, D., Lewis, E. F., et al. 2021, ApJ, 922, 115 [CrossRef] [Google Scholar]
- Bassa, C. G., Tendulkar, S. P., Adams, E. A. K., et al. 2017, ApJ, 843, L8 [NASA ADS] [CrossRef] [Google Scholar]
- Bhat, P. N., Meegan, C. A., von Kienlin, A., et al. 2016, ApJS, 223, 28 [Google Scholar]
- Bondonneau, L., Grießmeier, J. M., Theureau, G., et al. 2021, A&A, 652, A34 [NASA ADS] [CrossRef] [EDP Sciences] [Google Scholar]
- Braga, C. A., Cruces, M., Cassanelli, T., et al. 2025, A&A, 693, A40 [NASA ADS] [CrossRef] [EDP Sciences] [Google Scholar]
- Chatterjee, S., Law, C. J., Wharton, R. S., et al. 2017, Nature, 541, 58 [NASA ADS] [CrossRef] [Google Scholar]
- Chen, G., Ravi, V., & Hallinan, G. W. 2023, ApJ, 958, 185 [Google Scholar]
- Collins, P., Kyne, G., Lara, D., et al. 2013, Exp. Astron., 36, 479 [Google Scholar]
- Cordes, J. M., Wasserman, I., Hessels, J. W. T., et al. 2017, ApJ, 842, 35 [Google Scholar]
- Cruces, M., Spitler, L. G., Scholz, P., et al. 2021, MNRAS, 500, 448 [Google Scholar]
- Decoene, V., Zarka, P., Ng, C., et al. 2023, in SF2A-2023: Proceedings of the Annual meeting of the French Society of Astronomy and Astrophysics, eds. M. N’Diaye, A. Siebert, N. Lagarde, et al., 137 [Google Scholar]
- DeLaunay, J. J., Fox, D. B., Murase, K., et al. 2016, ApJ, 832, L1 [NASA ADS] [CrossRef] [Google Scholar]
- Desvignes, G., Barott, W. C., Cognard, I., Lespagnol, P., & Theureau, G. 2011, in Radio Pulsars: An Astrophysical Key to Unlock the Secrets of the Universe, eds. M. Burgay, N. D’Amico, P. Esposito, A. Pellizzoni, & A. Possenti (AIP), AIP Conf. Ser., 1357, 349 [Google Scholar]
- Fonseca, E., Pleunis, Z., Breitman, D., et al. 2024, ApJS, 271, 49 [Google Scholar]
- Gajjar, V., Siemion, A. P. V., Price, D. C., et al. 2018, ApJ, 863, 2 [NASA ADS] [CrossRef] [Google Scholar]
- Hardy, L. K., Dhillon, V. S., Spitler, L. G., et al. 2017, MNRAS, 472, 2800 [NASA ADS] [CrossRef] [Google Scholar]
- Hessels, J. W. T., Spitler, L. G., Seymour, A. D., et al. 2019, ApJ, 876, L23 [Google Scholar]
- Hewitt, D. M., Snelders, M. P., Hessels, J. W. T., et al. 2022, MNRAS, 515, 3577 [NASA ADS] [CrossRef] [Google Scholar]
- Houben, L. J. M., Spitler, L. G., ter Veen, S., et al. 2019, A&A, 623, A42 [NASA ADS] [CrossRef] [EDP Sciences] [Google Scholar]
- Jahns, J. N., Spitler, L. G., Nimmo, K., et al. 2023, MNRAS, 519, 666 [Google Scholar]
- Josephy, A., Chawla, P., Fonseca, E., et al. 2019, ApJ, 882, L18 [NASA ADS] [CrossRef] [Google Scholar]
- Kashiyama, K., & Murase, K. 2017, ApJ, 839, L3 [NASA ADS] [CrossRef] [Google Scholar]
- Kyne, G. 2014, Ph.D. Thesis, National University of Ireland Galway [Google Scholar]
- Lebrun, F., Leray, J. P., Lavocat, P., et al. 2003, A&A, 411, L141 [NASA ADS] [CrossRef] [EDP Sciences] [Google Scholar]
- Li, D., Wang, P., Zhu, W. W., et al. 2021, Nature, 598, 267 [CrossRef] [Google Scholar]
- Liu, T., Romero, G. E., Liu, M.-L., & Li, A. 2016, ApJ, 826, 82 [NASA ADS] [CrossRef] [Google Scholar]
- Lorimer, D. R., Bailes, M., McLaughlin, M. A., Narkevic, D. J., & Crawford, F. 2007, Science, 318, 777 [Google Scholar]
- Lyne, A. G., Pritchard, R. S., & Graham Smith, F. 1993, MNRAS, 265, 1003 [NASA ADS] [CrossRef] [Google Scholar]
- Lyubarsky, Y. 2014, MNRAS, 442, L9 [Google Scholar]
- Lyutikov, M. 2002, ApJ, 580, L65 [NASA ADS] [CrossRef] [Google Scholar]
- Marcote, B., Paragi, Z., Hessels, J. W. T., et al. 2017, ApJ, 834, L8 [CrossRef] [Google Scholar]
- Margalit, B., Berger, E., & Metzger, B. D. 2019, ApJ, 886, 110 [NASA ADS] [CrossRef] [Google Scholar]
- Margalit, B., Metzger, B. D., & Sironi, L. 2020, MNRAS, 494, 4627 [Google Scholar]
- Mereghetti, S., Savchenko, V., Ferrigno, C., et al. 2020, ApJ, 898, L29 [Google Scholar]
- Metzger, B. D., Berger, E., & Margalit, B. 2017, ApJ, 841, 14 [NASA ADS] [CrossRef] [Google Scholar]
- Michilli, D., Seymour, A., Hessels, J. W. T., et al. 2018, Nature, 553, 182 [Google Scholar]
- Murase, K., Mészáros, P., & Fox, D. B. 2017, ApJ, 836, L6 [NASA ADS] [CrossRef] [Google Scholar]
- O’Connor, E. 2018, Ph.D. Thesis, National University of Ireland Galway [Google Scholar]
- O’Connor, E. G. P., Shearer, A., Gouiffes, C., & Laurent, P. 2018, in Pulsar Astrophysics the Next Fifty Years, eds. P. Weltevrede, B. B. P. Perera, L. L. Preston, & S. Sanidas, 337, 384 [Google Scholar]
- Oostrum, L. C., Maan, Y., van Leeuwen, J., et al. 2020, A&A, 635, A61 [NASA ADS] [CrossRef] [EDP Sciences] [Google Scholar]
- Platts, E., Caleb, M., Stappers, B. W., et al. 2021, MNRAS, 505, 3041 [NASA ADS] [CrossRef] [Google Scholar]
- Rajwade, K. M., Mickaliger, M. B., Stappers, B. W., et al. 2020, MNRAS, 495, 3551 [NASA ADS] [CrossRef] [Google Scholar]
- Ransom, S. 2011, PRESTO: PulsaR Exploration and Search TOolkit, Astrophysics Source Code Library [record ascl:1107.017] [Google Scholar]
- Scholz, P., Bogdanov, S., Hessels, J. W. T., et al. 2017, ApJ, 846, 80 [NASA ADS] [CrossRef] [Google Scholar]
- Shearer, A., Stappers, B., O’Connor, P., et al. 2003, Science, 301, 493 [Google Scholar]
- Słowikowska, A., Kanbach, G., Kramer, M., & Stefanescu, A. 2009, MNRAS, 397, 103 [CrossRef] [Google Scholar]
- Spitler, L. G., Cordes, J. M., Hessels, J. W. T., et al. 2014, ApJ, 790, 101 [NASA ADS] [CrossRef] [Google Scholar]
- Spitler, L. G., Scholz, P., Hessels, J. W. T., et al. 2016, Nature, 531, 202 [NASA ADS] [CrossRef] [Google Scholar]
- Sridhar, N., Zrake, J., Metzger, B. D., Sironi, L., & Giannios, D. 2021, MNRAS, 501, 3184 [NASA ADS] [CrossRef] [Google Scholar]
- Tendulkar, S. P., Kaspi, V. M., & Patel, C. 2016, ApJ, 827, 59 [NASA ADS] [CrossRef] [Google Scholar]
- Tendulkar, S. P., Bassa, C. G., Cordes, J. M., et al. 2017, ApJ, 834, L7 [NASA ADS] [CrossRef] [Google Scholar]
- Ubertini, P., Lebrun, F., Di Cocco, G., et al. 2003, A&A, 411, L131 [CrossRef] [EDP Sciences] [Google Scholar]
- Wang, P., Zhang, J. S., Yang, Y. P., et al. 2025, arXiv e-prints [arXiv:2507.15790] [Google Scholar]
- Wei, J., Cordier, B., Antier, S., et al. 2016, arXiv e-prints [arXiv:1610.06892] [Google Scholar]
- Wei, Y., Zhang, B. T., & Murase, K. 2023, MNRAS, 524, 6004 [Google Scholar]
- Yang, Y.-P., Zhang, B., & Wei, J.-Y. 2019, ApJ, 878, 89 [Google Scholar]
- Zarka, P., Denis, L., Tagger, M., et al. 2020, in URSI GASS 2020, Rome, Italy [Google Scholar]
- Zhang, B. 2014, ApJ, 780, L21 [Google Scholar]
Appendix A: Additional plots
Figure A.1 shows the Crab light curve and provisional linear polarization profile detected during the 2017 campaign described in Section 3.1.
Fig. A.2 compares burst parameters as a function of time for the radio bursts detected using the NRT between 2016 and 2019. We see no significant temporal trend in the width and emission range/bandwidth distribution that correlates with the linearly increasing DM trend described in Section 3.3. The emission range and bandwidth appear random, with no visible clustering for bursts that are closer in time. Overall, we can detect FRB 20121102A throughout the entire 1230–1740 MHz band of the NRT, even though individual bursts might be band-limited (see Fig. 9).
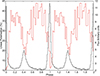 |
Fig. A.1. GASP observations of the Crab pulsar taken during the 2017 campaign. The plot shows a 1-hour observation starting at 2017-09-29 02:20:01. The red line shows the linear polarization and the black line is the optical light curve referenced to the Jodrell Bank ephemeris, Lyne et al. (1993) and http://www.jb.man.ac.uk/~pulsar/crab.html. The linear polarization in the off-pulse region, from phase 0.7–0.9, is 37 ± 5% consistent with other measurements, see, e.g., Słowikowska et al. (2009) |
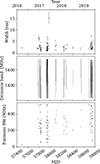 |
Fig. A.2. Burst properties (width, emission range and bandwidth) as a function of time for FRB 20121102A. |
Appendix B: Table of NRT burst parameters
In Appendix B.1, we present the FITBURST-derived parameters for the 131 NRT bursts detected between 2016 and 2019. All fits were obtained using full resolution data (Δt = 256 μs, Δν = 2 MHz), except 10 bursts where the signal-to-noise ratios are too low and a downsampling factor of 2 is needed in frequency and in time. For the 7 bursts with multiple components, the arrival times correspond to the first component and the widths are the sum of each of the separate components. These parameters are listed in Table B.1.
All Tables
All Figures
|
Fig. 1. INTEGRAL image at the sky position of FRB 20121102A taken during revolution 1867 at 25–100 keV. The grayscale bar gives the sources significance over the field of view. Only the Crab pulsar is clearly detected at more than 50 sigmas (given a detection threshold of 5 sigma). |
| In the text | |
|
Fig. 2. GASP observation of FRB 20121102A from the 2017 campaign. The plot, from the night of September 27, shows the flux in each 0.9-ms frame. In total, there were ≈13.7 million frames. Shown are the EMCCD counts (left y axis) from the FRB region in each frame (left y-axis) and the flux in mJy ms (right y axis). Also shown is the 5σ upper limit. From 13.7 million frames, we expected to observe 4.1 frames with a flux above 5σ. The fact that we see five frames above 5σ implies no significant enhancement is detected. |
| In the text | |
|
Fig. 3. 1.5′ × 1.5′ sub-section of our R-band stacked image obtained in the field of FRB 20121102A with the T120cm telescope at Observatoire de Haute-Provence. The expected location of FRB 20121102A is indicated with the empty black circle at the center. North is to the top and east is to the left. |
| In the text | |
|
Fig. 4. Time windows of the telescope facilities that participated in the 2019 campaign. Each radio burst detected is shown as a vertical black tick. |
| In the text | |
|
Fig. 5. INTEGRAL image at the sky position of FRB 20121102A at 25–100 keV, stacking all observations taken during the 2019 campaign. The grayscale bar gives the sources significance over the field of view. |
| In the text | |
|
Fig. 6. (Top panel) Fluences vs date (black dots) of the NRT detected bursts from FRB 20121102A. Non-detections from NRT are indicated by small gray tick marks at the bottom of the panel. The epochs of the INTEGRAL observations are marked by vertical orange lines. We also include the time stamps of the observations with bursts and non-detections from Braga et al. (2025) (blue) and Wang et al. (2025) (red). Note that these positive-detection data points from the literature are arbitrarily placed at y = 1 Jy ms as fluence info is not readily available. The grayed region indicates an active window as calculated by combining all these data. We obtain a period of 158.1(3) days, referencing MJD = 50127.5 and an activity window of 62% centered at phase = 0.5. (Bottom panel) The duration of NRT observations in each active (gray) and inactive (dark gray) period are shown. |
| In the text | |
|
Fig. 7. Lomb-Scargle periodogram for binary detection mode following the code from Braga et al. (2025), applied to the NRT data set combined with all historical data from Braga et al. (2025) and Wang et al. (2025). The first candidate of the periodogram is a periodicity of 158.1(3) days, indicated by the vertical dashed line. The dotted horizontal lines correspond to the 1σ, 3σ, and 5σ significance levels determined by conducting 10000 bootstrap resamplings. |
| In the text | |
|
Fig. 8. Temporal DM variation seen in FRB 20121102A. The linear trend is fitting by taking into account the clustering density of the data points as well as the uncertainty associated with each DM. |
| In the text | |
|
Fig. 9. Probability density functions (PDFs) for the NRT burst width distributions. |
| In the text | |
|
Fig. 10. Waterfall (frequency-time) plot of one of the brightest bursts detected at NRT on 2019-09-07. The lateral panel on the top shows the amplitude in Jy as a function of time, while the lateral panel on the right shows the spectrum. |
| In the text | |
|
Fig. 11. Frequency distribution of the central frequencies and the bandwidth for the NRT burst sample. |
| In the text | |
|
Fig. 12. Limits on the energy of X-ray and gamma-ray bursts at the time of radio bursts from FRB 20121102A (in blue; from Scholz et al. (2017) and in green; this work). The 0.5–10 keV data are from Chandra, 10–100 keV from Fermi/GBM and 25–400 keV from INTEGRAL. The dashed lines indicate 5σ upper limits for a single radio burst, whereas the solid lines indicate stacking multiple detected radio bursts. We do not include our optical limit in this plot as that was not obtained concurrently with radio bursts. |
| In the text | |
|
Fig. A.1. GASP observations of the Crab pulsar taken during the 2017 campaign. The plot shows a 1-hour observation starting at 2017-09-29 02:20:01. The red line shows the linear polarization and the black line is the optical light curve referenced to the Jodrell Bank ephemeris, Lyne et al. (1993) and http://www.jb.man.ac.uk/~pulsar/crab.html. The linear polarization in the off-pulse region, from phase 0.7–0.9, is 37 ± 5% consistent with other measurements, see, e.g., Słowikowska et al. (2009) |
| In the text | |
|
Fig. A.2. Burst properties (width, emission range and bandwidth) as a function of time for FRB 20121102A. |
| In the text | |
Current usage metrics show cumulative count of Article Views (full-text article views including HTML views, PDF and ePub downloads, according to the available data) and Abstracts Views on Vision4Press platform.
Data correspond to usage on the plateform after 2015. The current usage metrics is available 48-96 hours after online publication and is updated daily on week days.
Initial download of the metrics may take a while.