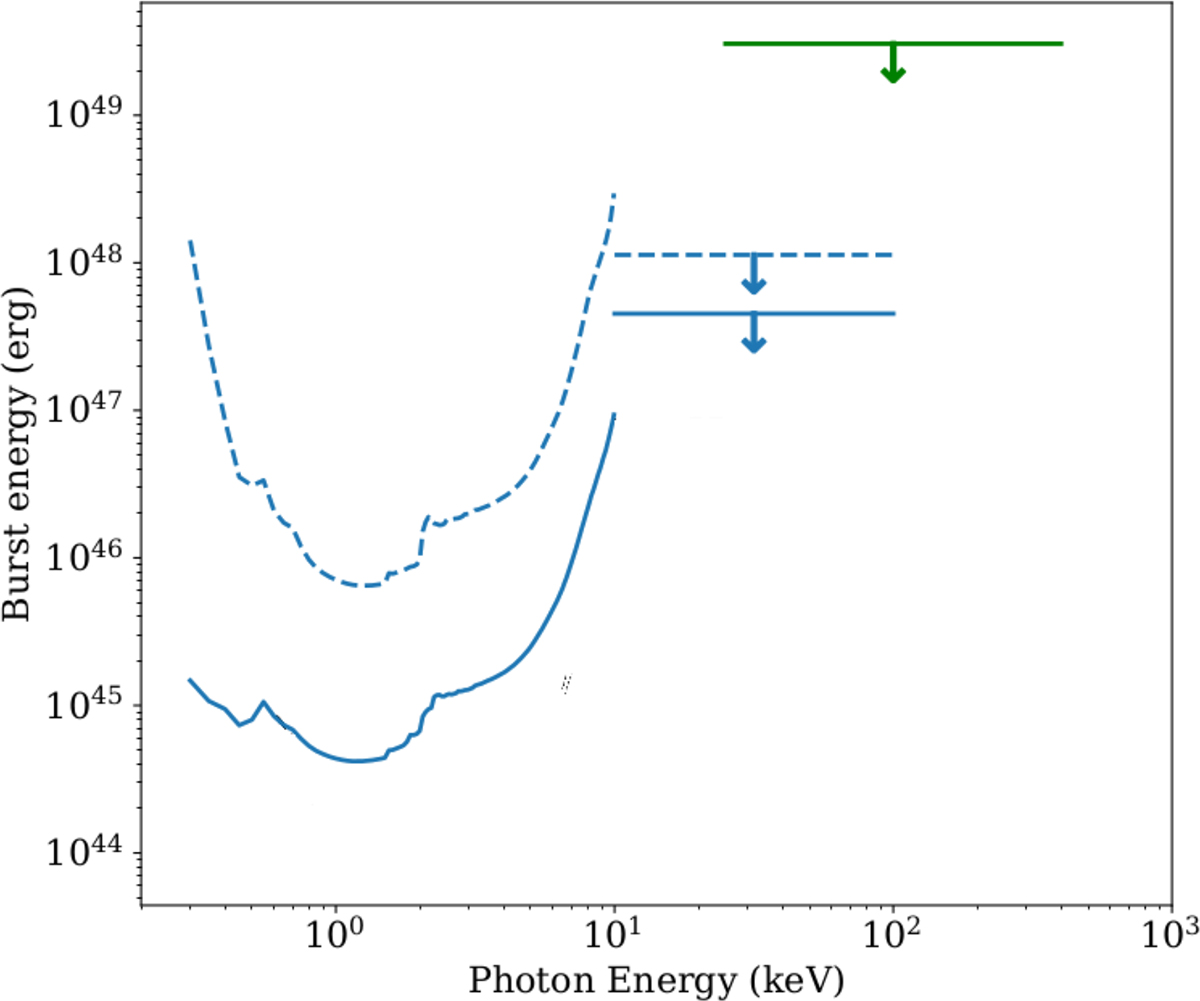
Fig. 12.
Download original image
Limits on the energy of X-ray and gamma-ray bursts at the time of radio bursts from FRB 20121102A (in blue; from Scholz et al. (2017) and in green; this work). The 0.5–10 keV data are from Chandra, 10–100 keV from Fermi/GBM and 25–400 keV from INTEGRAL. The dashed lines indicate 5σ upper limits for a single radio burst, whereas the solid lines indicate stacking multiple detected radio bursts. We do not include our optical limit in this plot as that was not obtained concurrently with radio bursts.
Current usage metrics show cumulative count of Article Views (full-text article views including HTML views, PDF and ePub downloads, according to the available data) and Abstracts Views on Vision4Press platform.
Data correspond to usage on the plateform after 2015. The current usage metrics is available 48-96 hours after online publication and is updated daily on week days.
Initial download of the metrics may take a while.