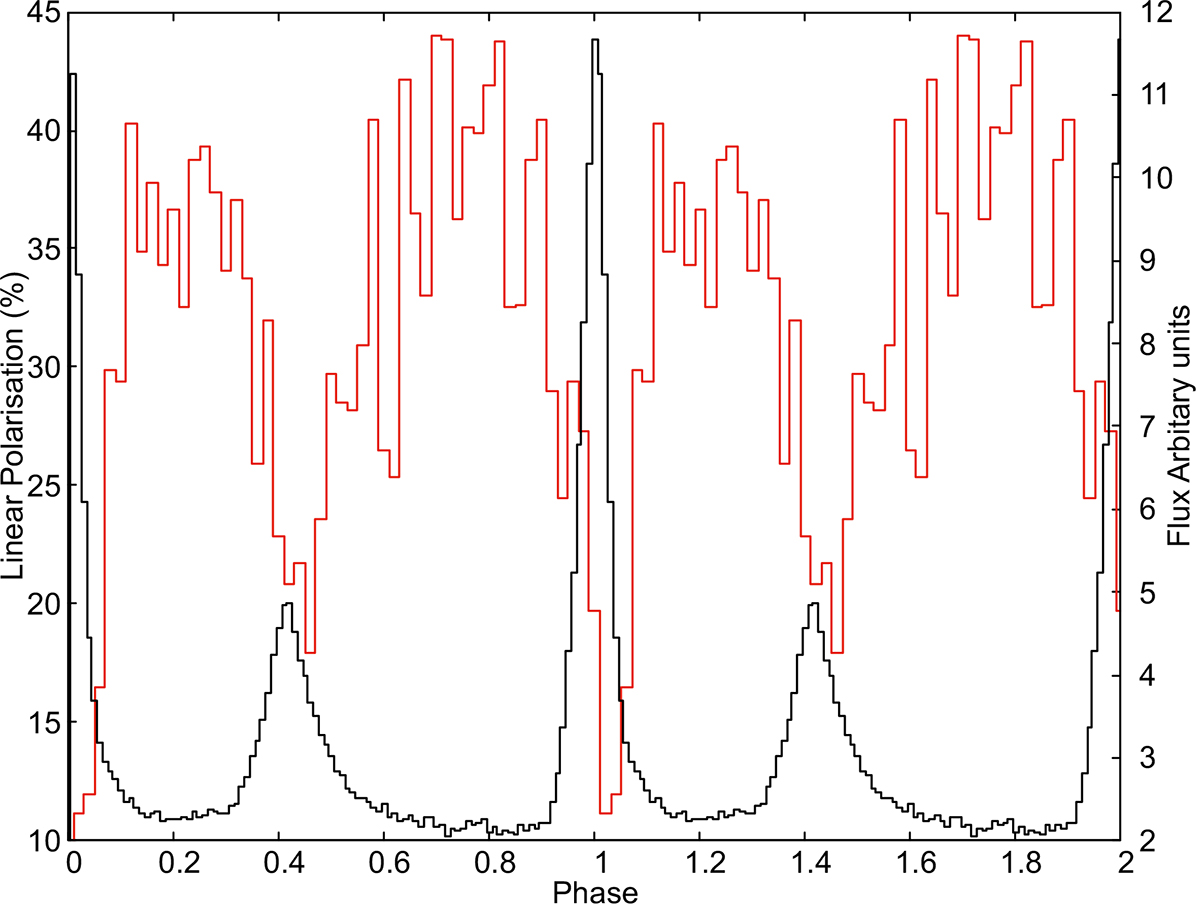
Fig. A.1.
Download original image
GASP observations of the Crab pulsar taken during the 2017 campaign. The plot shows a 1-hour observation starting at 2017-09-29 02:20:01. The red line shows the linear polarization and the black line is the optical light curve referenced to the Jodrell Bank ephemeris, Lyne et al. (1993) and http://www.jb.man.ac.uk/~pulsar/crab.html. The linear polarization in the off-pulse region, from phase 0.7–0.9, is 37 ± 5% consistent with other measurements, see, e.g., Słowikowska et al. (2009)
Current usage metrics show cumulative count of Article Views (full-text article views including HTML views, PDF and ePub downloads, according to the available data) and Abstracts Views on Vision4Press platform.
Data correspond to usage on the plateform after 2015. The current usage metrics is available 48-96 hours after online publication and is updated daily on week days.
Initial download of the metrics may take a while.