Fig. 2.
Download original image
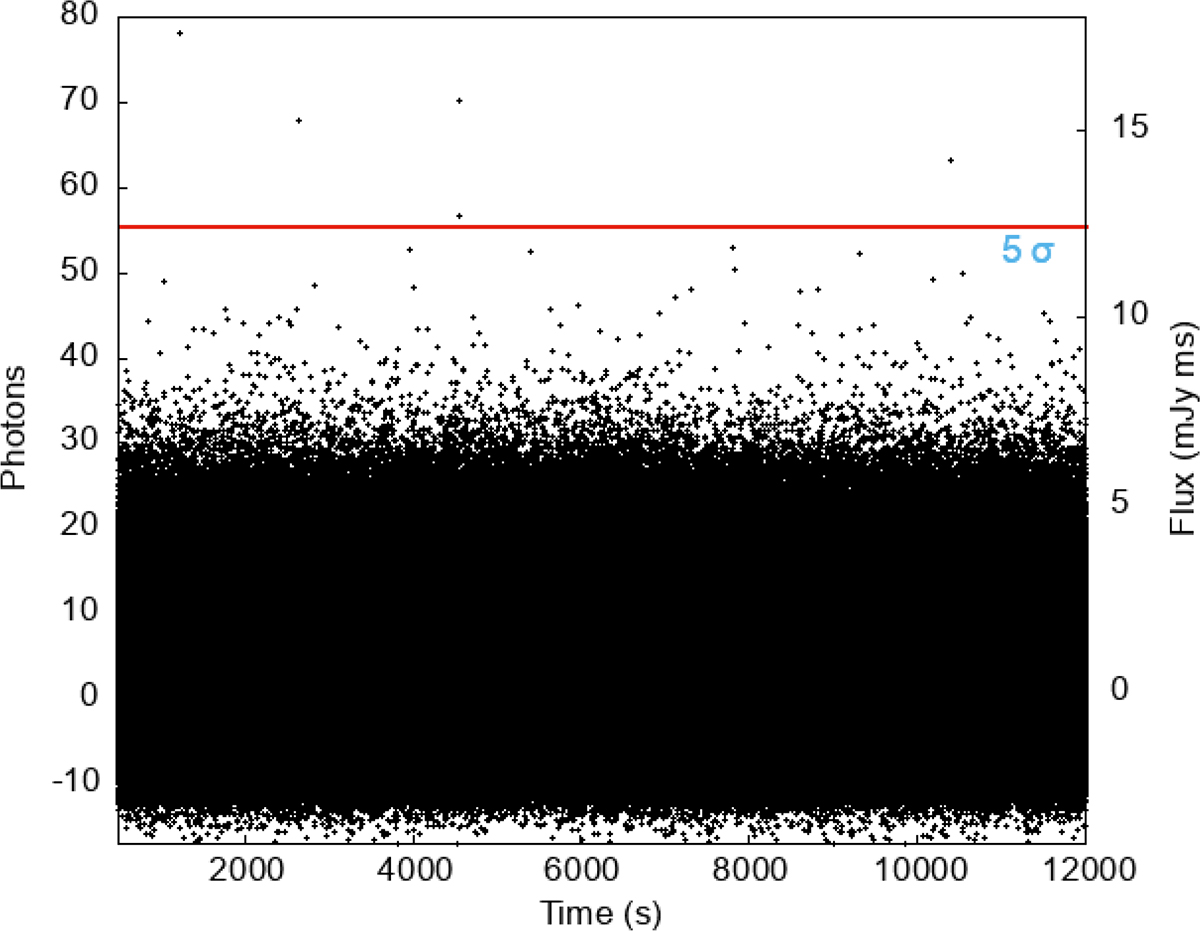
GASP observation of FRB 20121102A from the 2017 campaign. The plot, from the night of September 27, shows the flux in each 0.9-ms frame. In total, there were ≈13.7 million frames. Shown are the EMCCD counts (left y axis) from the FRB region in each frame (left y-axis) and the flux in mJy ms (right y axis). Also shown is the 5σ upper limit. From 13.7 million frames, we expected to observe 4.1 frames with a flux above 5σ. The fact that we see five frames above 5σ implies no significant enhancement is detected.
Current usage metrics show cumulative count of Article Views (full-text article views including HTML views, PDF and ePub downloads, according to the available data) and Abstracts Views on Vision4Press platform.
Data correspond to usage on the plateform after 2015. The current usage metrics is available 48-96 hours after online publication and is updated daily on week days.
Initial download of the metrics may take a while.