Fig. 6.
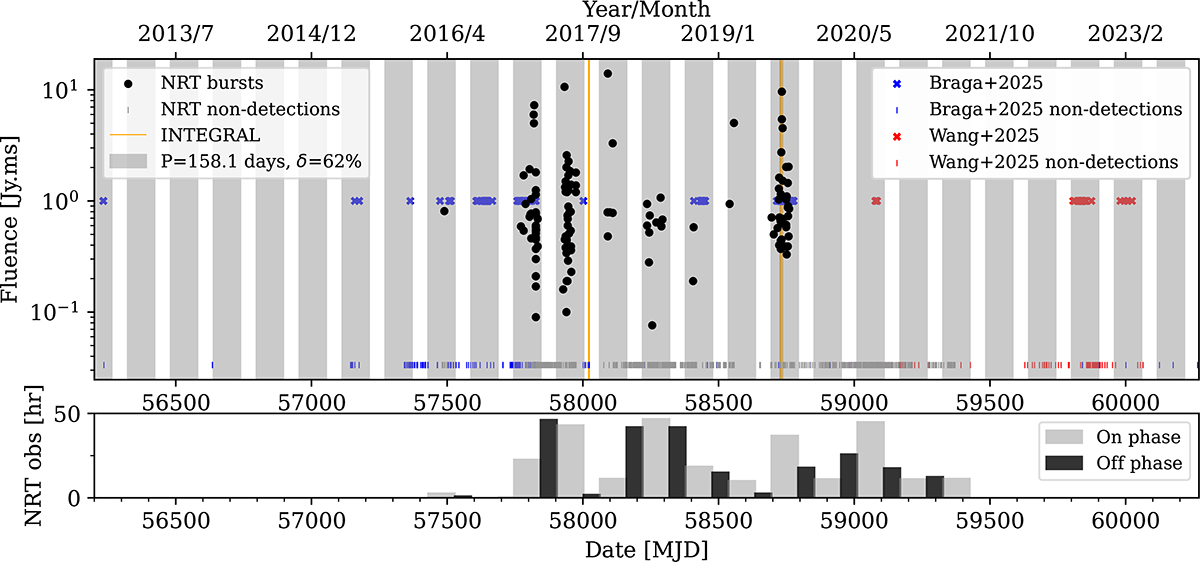
Download original image
(Top panel) Fluences vs date (black dots) of the NRT detected bursts from FRB 20121102A. Non-detections from NRT are indicated by small gray tick marks at the bottom of the panel. The epochs of the INTEGRAL observations are marked by vertical orange lines. We also include the time stamps of the observations with bursts and non-detections from Braga et al. (2025) (blue) and Wang et al. (2025) (red). Note that these positive-detection data points from the literature are arbitrarily placed at y = 1 Jy ms as fluence info is not readily available. The grayed region indicates an active window as calculated by combining all these data. We obtain a period of 158.1(3) days, referencing MJD = 50127.5 and an activity window of 62% centered at phase = 0.5. (Bottom panel) The duration of NRT observations in each active (gray) and inactive (dark gray) period are shown.
Current usage metrics show cumulative count of Article Views (full-text article views including HTML views, PDF and ePub downloads, according to the available data) and Abstracts Views on Vision4Press platform.
Data correspond to usage on the plateform after 2015. The current usage metrics is available 48-96 hours after online publication and is updated daily on week days.
Initial download of the metrics may take a while.