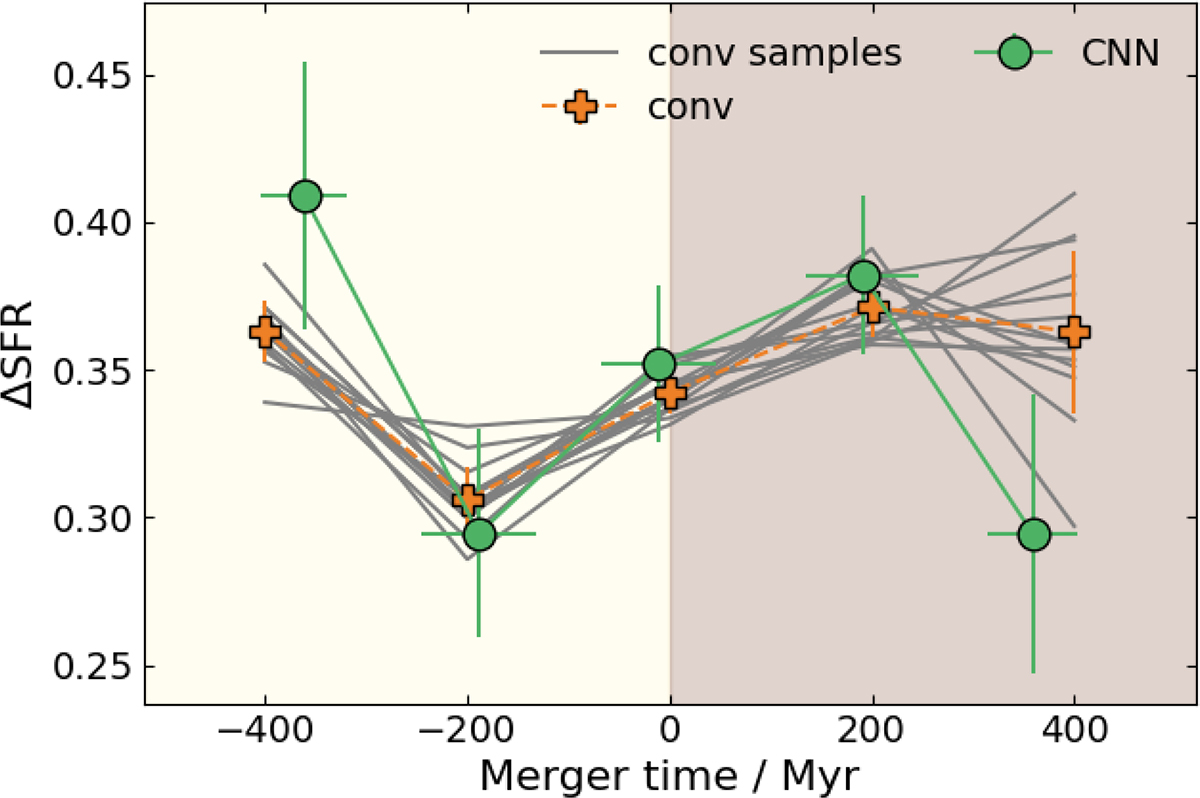
Fig. 12.
Download original image
ΔSFR as a function of merger time. The green circles and orange pluses show the μ from the Gaussian fitting of the mergers using the CNN merger times and conv merger times, respectively. The errors on these points are the standard deviation of the merger times in the merger time bin (x axis) and the error in μ from the Gaussian fitting combined with bootstrapped ΔSFR uncertainty, for CNN merger time, or the standard deviation of ΔSFR, for conv (y axis). The grey lines show ΔSFR from the merger time re-samplings used to determine conv. Errors for these lines are omitted for clarity. The light shaded region indicates where pre-mergers should lie and the dark shaded region indicates where post-mergers should lie.
Current usage metrics show cumulative count of Article Views (full-text article views including HTML views, PDF and ePub downloads, according to the available data) and Abstracts Views on Vision4Press platform.
Data correspond to usage on the plateform after 2015. The current usage metrics is available 48-96 hours after online publication and is updated daily on week days.
Initial download of the metrics may take a while.