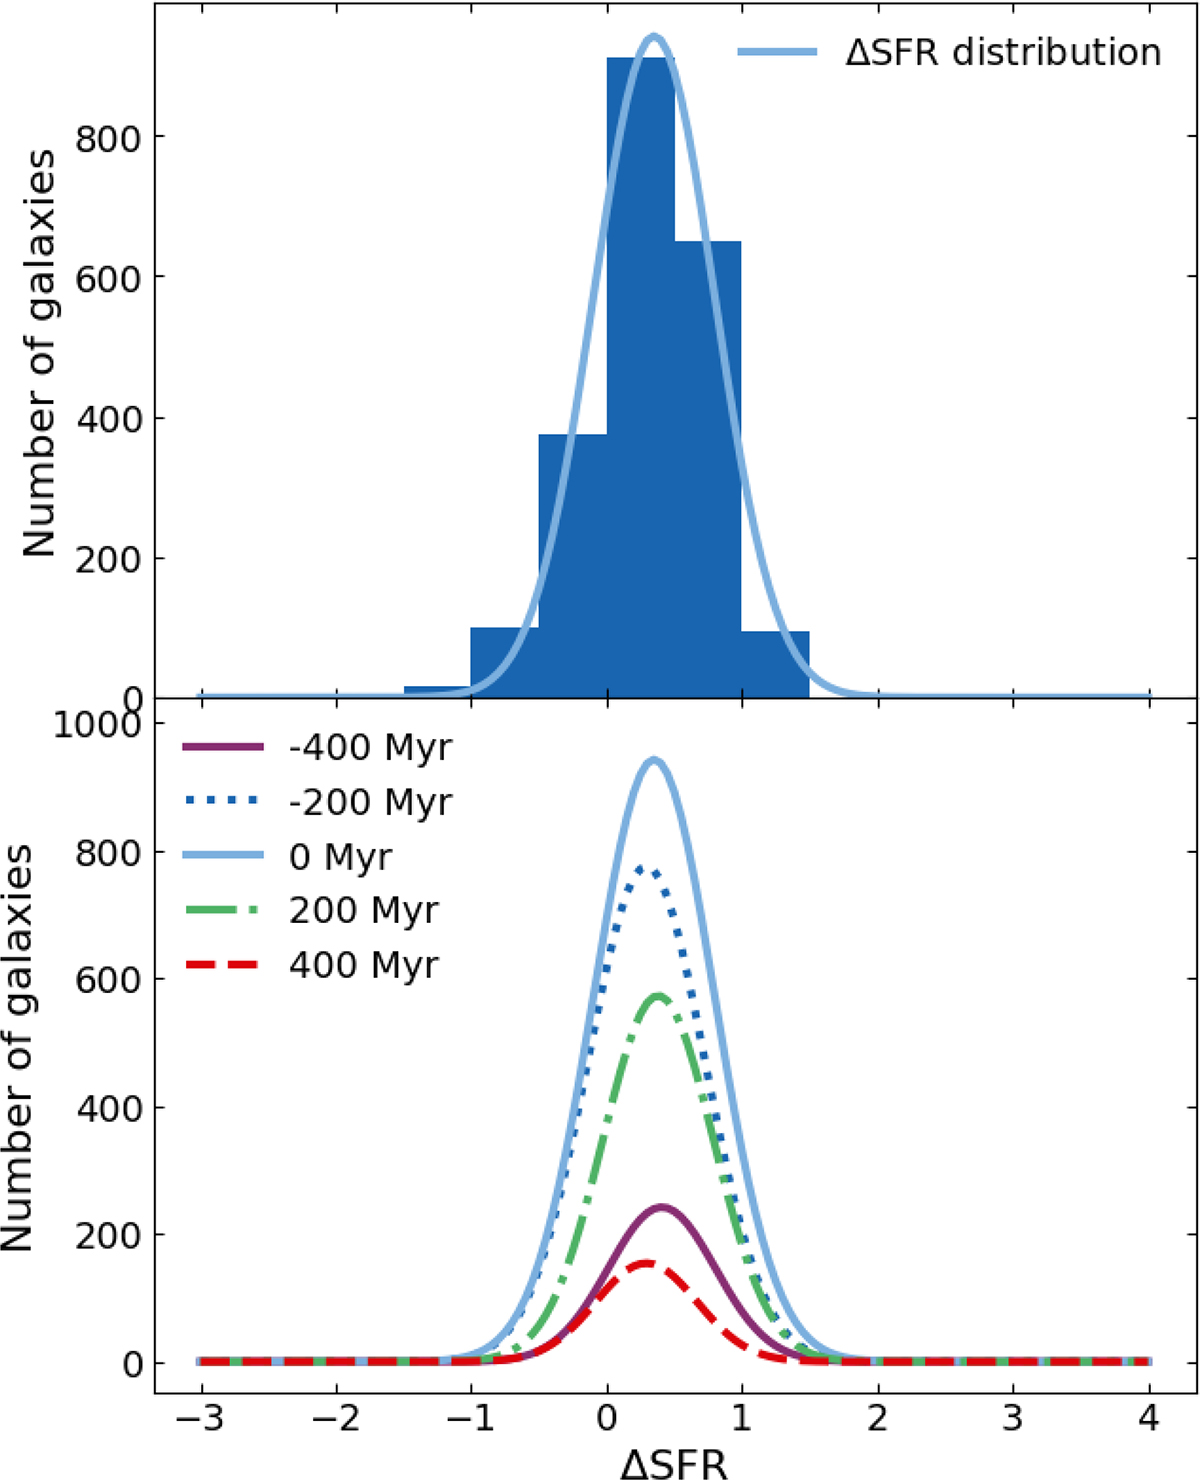
Fig. 7.
Download original image
Upper panel: Example of Gaussian fitting for the −100 Myr ≤ merger time < 0 Myr bin. Lower panel: Gaussian fitting for all five merger time bins where the fit succeeded. The Gaussian distributions for the bins centred on −400 Myr (solid purple), −200 Myr (dotted dark blue), 0 Myr (solid light blue), 200 Myr (dash-dotted green), and 400 Myr (dashed red) are shown.
Current usage metrics show cumulative count of Article Views (full-text article views including HTML views, PDF and ePub downloads, according to the available data) and Abstracts Views on Vision4Press platform.
Data correspond to usage on the plateform after 2015. The current usage metrics is available 48-96 hours after online publication and is updated daily on week days.
Initial download of the metrics may take a while.